Run the complete analysis in RainbowStats
Home | Blog | Command Reference | Launch RainbowStats
One of the pleasures of retirement is having time to pursue statistical questions simply because they are interesting.
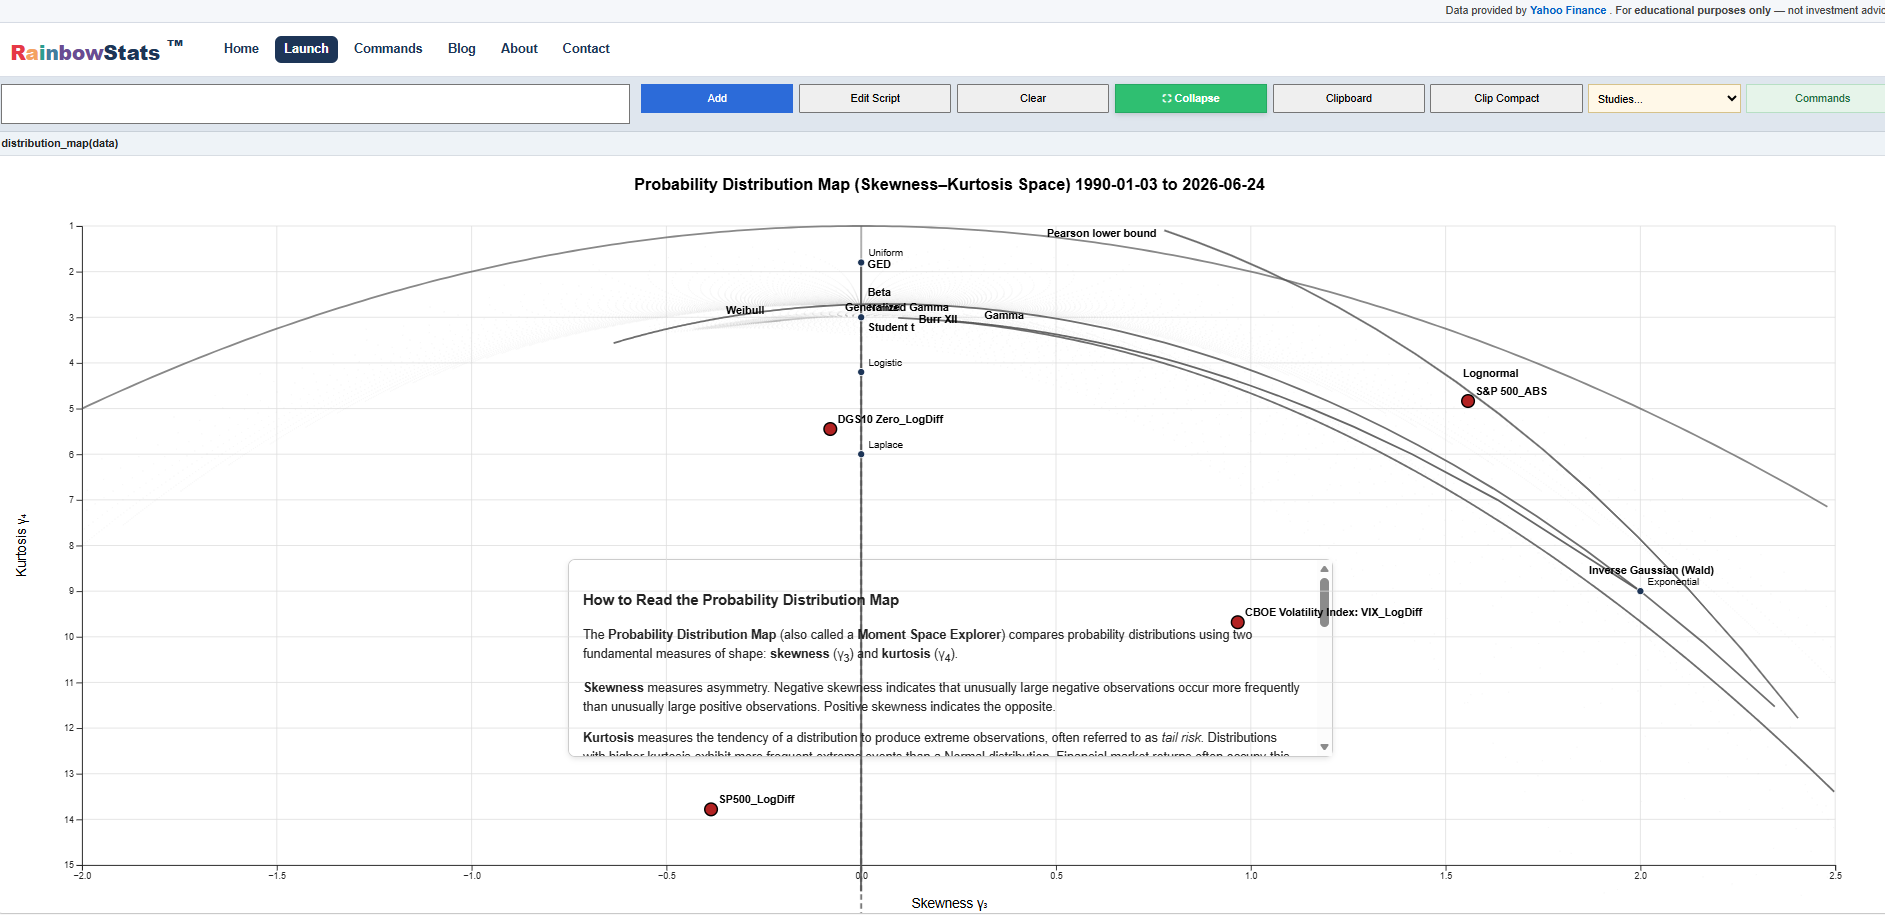
I recently wondered: are the higher moments of financial return distributions related? To explore this, I recreated the classic Moment-Ratio Diagrams for Univariate Distributions (Vargo, Pasupathy & Leemis, 2010) and applied them to actual market data.
The resulting visualization is quite revealing: equity returns exhibit dramatically higher kurtosis risk than Treasury returns.
This obvious result begs the question: at current P/E ratios are investor adequately compensated for a dramatic downturn of events?
I am not confident.
Explore the interactive distribution map here:
RainbowStats combines econometric modeling with interactive visualization to help identify these changing relationships, allowing users to move beyond static models and explore how the economy behaves across different regimes.