Run the analysis in RainbowStats
Home | Blog | Command Reference | Launch RainbowStats
At long last, I’ve added a more powerful scripting interface for Principal Component Analysis in RainbowStats.
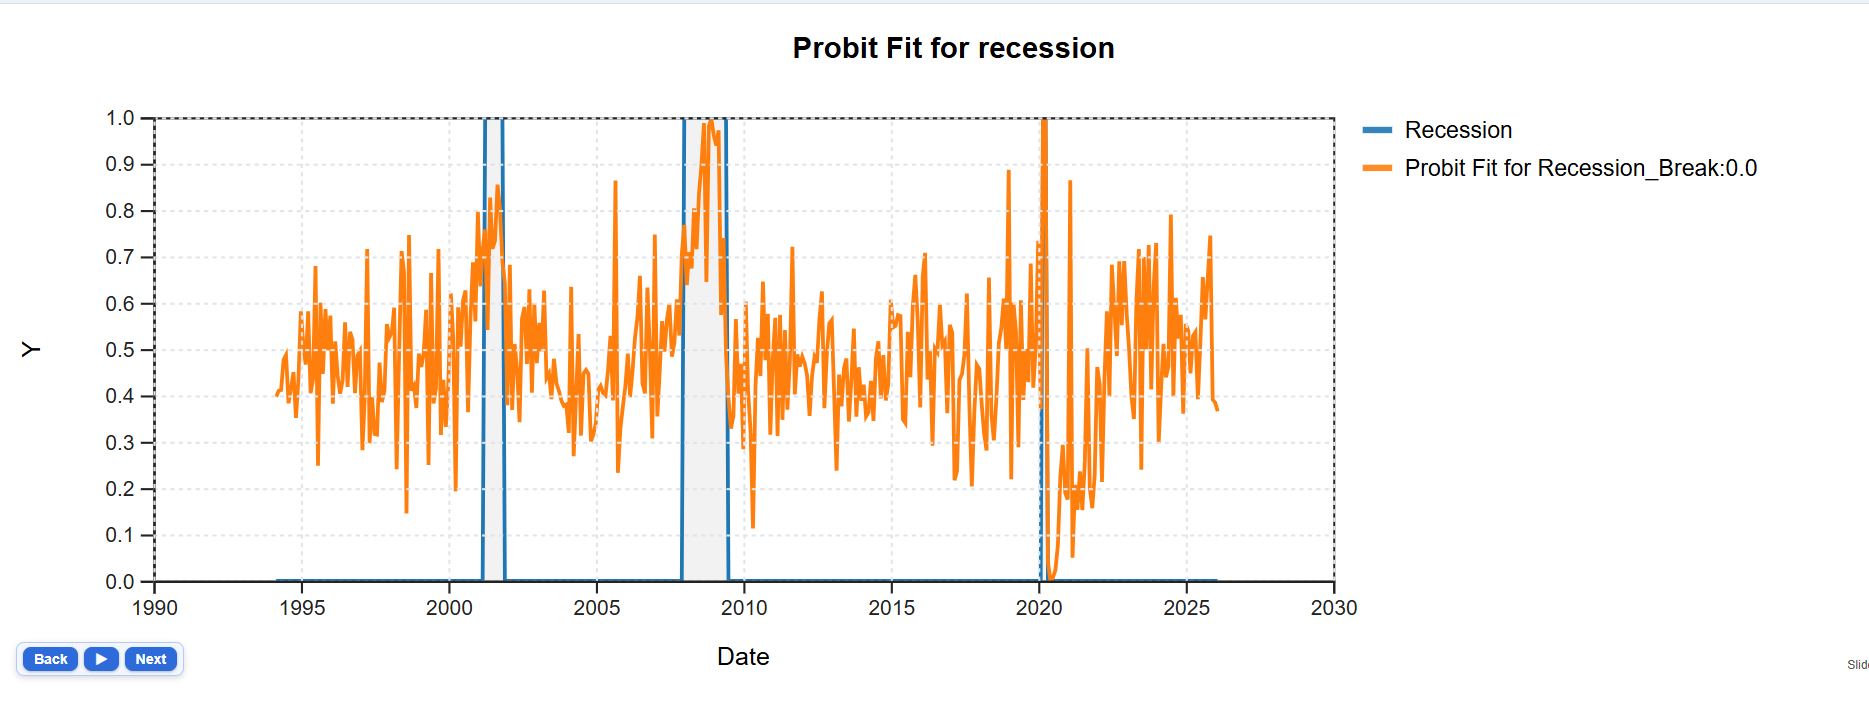
PCA can uncover an enormous amount of information hidden within a group of related time series. To make the results easier to interpret, I built a slideshow that walks through the analysis step by step—explained variance, factor loadings, correlations, regressions, and more.One feature I particularly like: can the principal components be used to identify recession periods? Looking at the probit results, the answer appears to be yes.
Click the link below to explore the slideshow and see the analysis in action.
l=Same_Date_Range(TCU,SP500,VIXCLS,DGS10,AAA10Y,CSUSHPINSA,U6Rate,BSCICP02USM460S+100)
slideshow(PC_Analysis(LOGDIFF(l)))
RainbowStats continues to evolve as a platform for combining financial modeling, econometrics, and interactive visualization.