Run the analysis in RainbowStats
Home | Blog | Command Reference | Launch RainbowStats
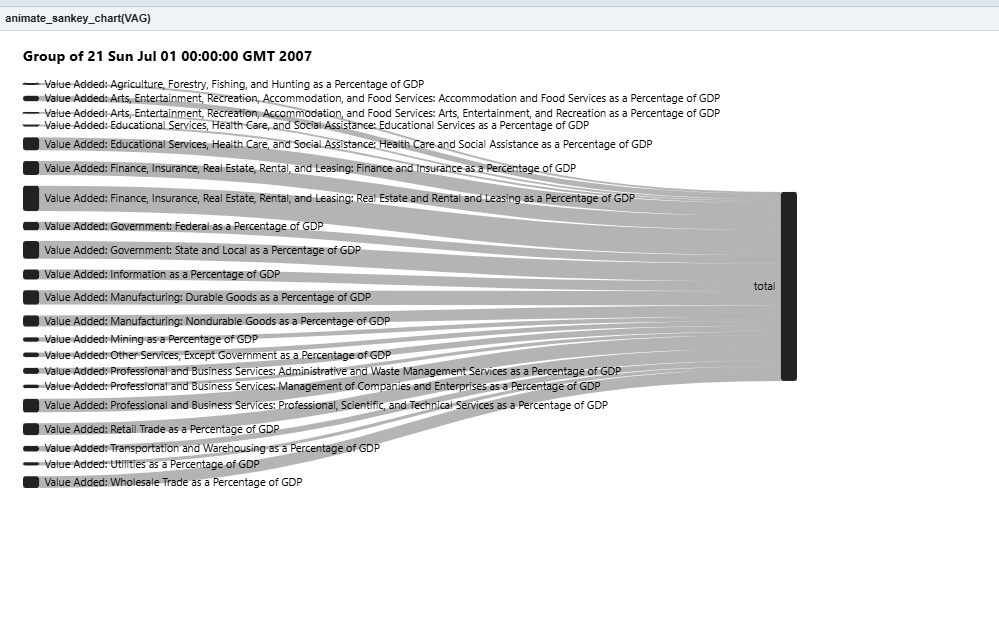
The focus on information technology and semiconductor manufacturing is important when discussing equity 500 valuations. However, those sectors alone do not describe the broader U.S. economy.
With just three lines of scripting, we can visualize the value added by each sector of the economy. Information technology may be highly profitable and dominate market capitalization, but it represents only a small portion of overall economic activity and does not fully reflect the economic reality experienced by most Americans.
epicycles(T10YIE,16)
RainbowStats continues to evolve as a platform for combining financial modeling, econometrics, and interactive visualization.