Explore and reproduce the four RainbowStats charts
A scatter plot can be irresistible. Put the yen on one axis and a bond price on the other, draw a regression line, and a story seems to appear: the yen carry trade drove the bond market. But prices can move together because both respond to the same news. A strong fitted line does not reveal who traded, where the losses landed, or how those losses reached a funding desk.
We can ask a better question. If a yen-funded position unwinds, what traces should it leave at each stage? First, yen shorts should be closed. Next, asset prices should reprice as investors adjust exposures and expectations. Then dealers should see changes in requests for collateralized funding. Finally, the terms at which they provide that funding may change. Our four charts follow that proposed path. They do not turn correlation into a controlled experiment, but they make the mechanism more specific—and more open to being contradicted by the data.
Step 1. The yen short is closed
Chart 1: Non-commercial yen futures positions versus USD/JPY, July–September 2024. The yen price is on the horizontal axis; net futures positioning is on the vertical axis. A lower USD/JPY quotation means a stronger yen.
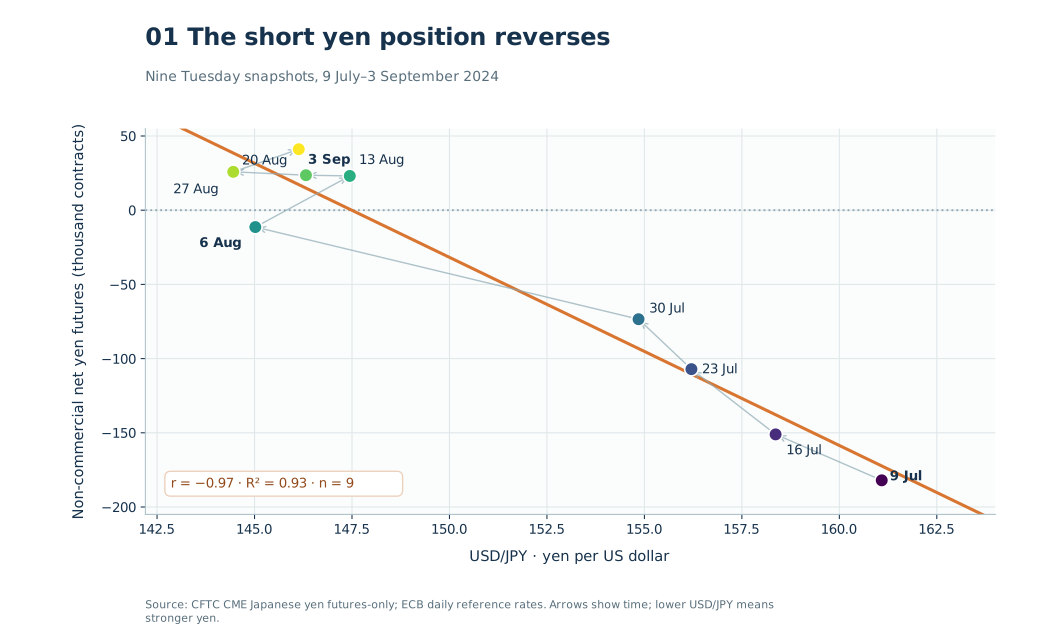
On 9 July, non-commercial traders in CME yen futures held 41,521 long and 223,554 short contracts, a net short of 182,033. By 6 August the net short was only 11,354 contracts. By 27 August it had become a net long of 25,868 contracts. Over those weeks, the yen strengthened sharply against the dollar. The nine weekly observations form a striking scatter (r = −0.97), and the arrows on the chart show the sequence rather than leaving the reader to guess its direction.
This is our closest observation of the proposed trade. The futures series does not capture every bank loan, forward, swap, option, or offshore position. It does show a large reversal in one visible class of speculative yen exposure. The BIS has documented the August 2024 carry unwind and warned that estimates of its total size are incomplete. As a position financed in yen loses money when the yen rises, closing it can require buying yen, reinforcing the exchange-rate move.
Step 2. The bond market reprices
Chart 2: A synthetic ten-year U.S. Treasury zero-coupon price versus USD/JPY, September 2021 onward. The yen remains on the horizontal axis. RainbowStats converts the DGS10 constant-maturity yield into a standardized zero-price proxy on the vertical axis. This is a price calculated from a yield, not the observed return on a particular bond.
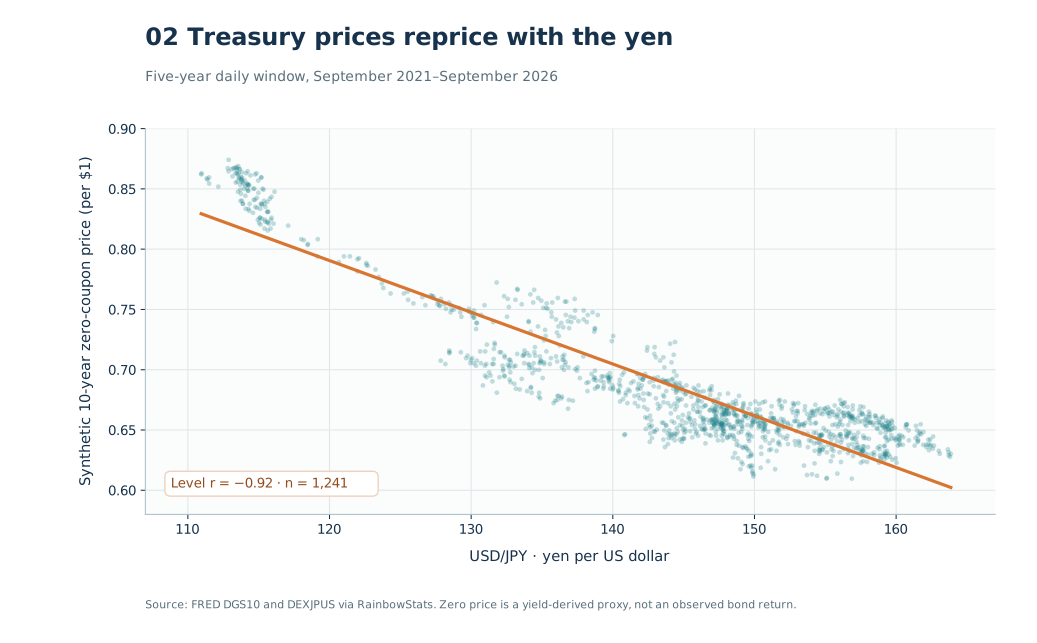
The five-year level scatter is strong (r about −0.92). Daily percentage changes retain a material negative correlation (about −0.42). In the third quarter of 2024, the yen strengthened while the ten-year yield fell from roughly 4.48% to 3.81% in our matched observations; the synthetic bond price rose about 6.6%.
That direction matters. A simple story in which carry traders sell Treasuries to repay yen borrowing would, by itself, push Treasury prices down. Our chart instead shows rising Treasury prices alongside the strengthening yen. The Federal Reserve’s September 2024 minutes attributed much of the decline in nominal Treasury yields to weaker U.S. data and lower expected policy rates, while also describing the rapid unwinding of speculative positions during the early-August turbulence. The bond chart records a cross-market repricing consistent with several simultaneous channels. It does not allocate a percentage of the bond move to carry-trade liquidation.
What SESFOD measures
The next two charts come from the ECB’s Survey on Credit Terms and Conditions in Euro-Denominated Securities Financing and OTC Derivatives Markets, or SESFOD. This is a quarterly, predominantly qualitative survey of major banks and dealers. The firms answer from the perspective of the lender or dealer offering terms to clients, not from the perspective of the clients seeking loans. The September 2024 round covered changes from June through August and drew responses from 26 large banks, split evenly between banks headquartered inside and outside the euro area.
The figures are net percentages of responding dealers, not euros of funding, basis points of spread, or counts of yen-carry traders. For these two questions the ECB’s published net-response convention is decreases minus increases. We multiply by −1, so a positive value on our charts means more respondents reported an increase than a decrease. Because the panel is small and the number answering a particular question may be smaller still, a move of several percentage points can represent only a few net responses.
SESFOD does not ask respondents to identify the currency in which a client funded a position. The survey can show pressure reaching euro-denominated securities financing desks. It cannot say which responses arose from yen carry trades. These charts are tests of a transmission mechanism, not a headcount of yen-funded borrowers.
That survey design also gives us something prices alone cannot: dealer sentiment about the breadth of changing market conditions. A Treasury yield is the result of trades; the SESFOD response tells us how many financing desks perceived an increase or decrease in client demand or in the terms they offered. These are reports about observed client interactions, not simply forecasts of where prices might go. If a shock is spreading through intermediaries, a net response across dealers is one way to see that diffusion. It is still a qualitative and coarse signal, and we should not read the net percentage as a measure of transaction volume.
Step 3. Dealers see demand for funding
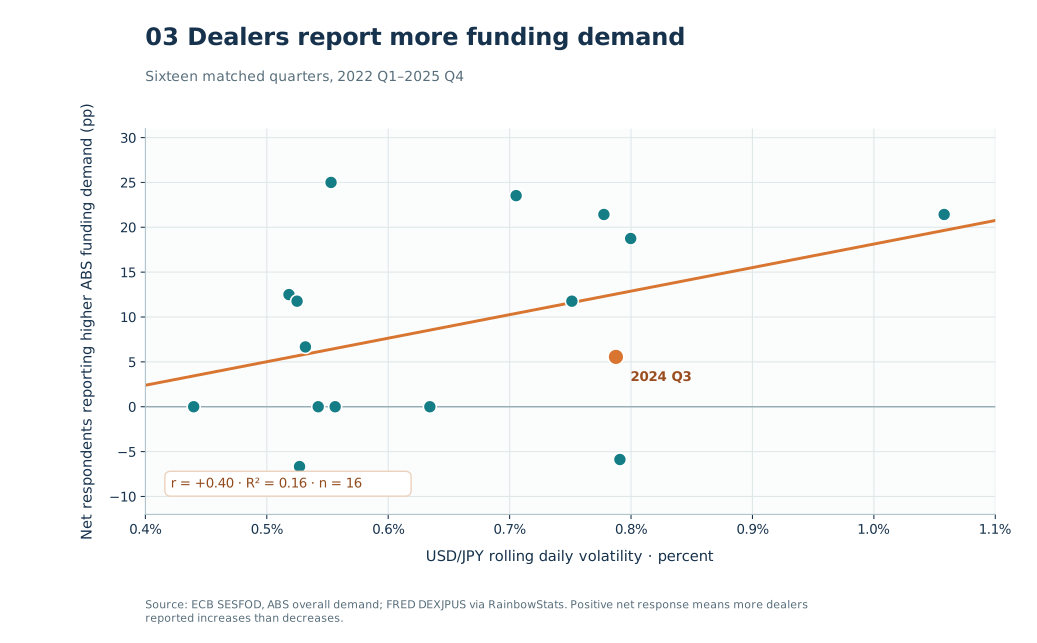
Chart 3: Demand for funding against asset-backed securities versus yen volatility. The horizontal axis is a 63-observation rolling standard deviation of daily USD/JPY log returns, averaged to a quarterly series. The vertical axis is the ECB’s net response on overall demand for funding against asset-backed securities (ABS), with increases displayed as positive values. There are 16 matched quarters in the plotted sample.
Why switch from the yen’s price to its volatility? The financing mechanism is about risk and cash needs. A sharp exchange-rate move can produce mark-to-market losses, trigger margin calls, and change the amount of collateral a leveraged client must finance. The direction of the exchange rate alone need not predict aggregate funding demand: one trader’s yen loss may be another’s gain, and many non-carry clients use these markets.
The fitted relationship is positive (r about +0.40). In the September 2024 SESFOD reading, the ABS funding-demand net response was about +5.6%. The ECB’s contemporaneous report also described increased demand for longer-term funding against several types of collateral, including ABS, and a net decline in hedge-fund financial leverage during the review period. Those observations fit the possibility of positions being resized while cash and collateral needs shifted. They do not identify the requesting clients or establish a lag from the CFTC futures reversal.
Step 4. The price of funding adjusts
Chart 4: Financing rate/spread for average clients borrowing against ABS versus the same yen-volatility measure. The chart uses the same collateral category and the same 16 quarterly FX observations as Chart 3. A positive dealer net response means financing rates or spreads increased. The fitted relationship is positive (r about +0.45).
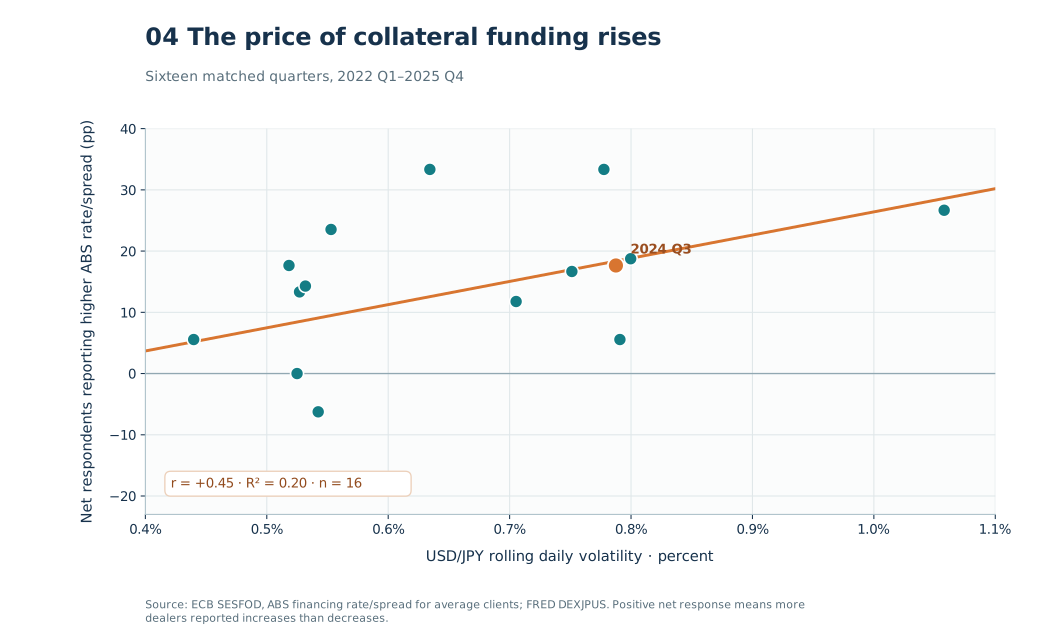
For the September 2024 reading, the ABS financing-rate/spread response was about +17.6%. The ECB reported rising financing rates or spreads for funding secured against every collateral type in that round, with ABS among the more pronounced increases. One plausible mechanism is that volatile markets raise the cost of dealer balance sheet, hedging, and liquidity while clients seek funding. The survey records the reported change in terms; it does not quantify the change in basis points or prove that yen positions caused it.
What four charts add—and what they do not
Each chart by itself invites a causal claim. A position scatter may merely track the price that encouraged traders to cover. A bond scatter can reflect common monetary-policy news. A funding survey cannot identify the borrower behind an answer. A spread survey can reflect broad dealer conditions rather than a single trade.
Together, the charts give us a more discriminating account: a visible yen-short reversal occurred; the yen and Treasury market repriced; and, in the same broad episode, euro-denominated collateral funding desks reported greater ABS funding demand and higher ABS financing rates/spreads. The first two charts trace traded positions and prices. The latter two add dealers’ reported experience of demand and credit terms: a separate kind of evidence about market sentiment and the breadth of financing pressure. That combination is consistent with a carry unwind propagating through market prices and financing conditions. The BIS independently identifies the August carry unwind and margin-driven deleveraging as part of the turbulence.
The timing is not equally precise at every step. Positions are weekly Tuesday snapshots, Treasury and FX prices are daily, and SESFOD summarizes a three-month review period. Charts 3 and 4 also share the same volatility series and dealer survey, so they are related evidence, not independent replications. We have not measured the volume of Treasury sales by yen-funded investors, isolated a shock to yen funding, or established that the dealer responses followed those particular accounts. The strong conclusion is that the proposed mechanism has multiple observable footprints. The narrower causal question—how much of each market move was caused by the carry unwind—remains open.
A single chart can suggest the story. Four charts let us inspect where the story holds, where another explanation is needed, and what data would have to come next. The next useful additions are direct yen borrowing or FX-swap positioning measures, more weekly CFTC history, and a benchmark for broader FX volatility. That is the difference between seeing a pattern and testing how it traveled.
Data and replication notes
- RainbowStats four-chart slideshow and script.
- CFTC, Commitments of Traders historical reports, CME Japanese yen futures, non-commercial futures-only long and short positions. The 16 July and 20 August observations in the companion JSON are reconstructed from the following week’s commitments and reported weekly changes.
- ECB, daily EUR/JPY and EUR/USD reference rates; Tuesday USD/JPY is their ratio. FRED DEXJPUS supplies the longer daily series.
- FRED, DGS10.
US_Zero(DGS10,10)is a standardized synthetic price based on the quoted ten-year constant-maturity yield. - ECB, September
2024 SESFOD summary, and SESFOD
survey background. Chart 3 uses
SESFOD.Q.U2.SFT.S2.DL.OD.Z.ABS.NET.PCT; Chart 4 usesSESFOD.Q.U2.SFT.S1.TA.FR.Z.ABS.NET.PCT. - BIS, The market turbulence and carry trade unwind of August 2024; Federal Reserve, September 2024 FOMC minutes.