One line now brings a global development question into RainbowStats. Search the World Bank catalog, name an outcome, add as many predictors as needed, and the platform aligns countries by ISO-3 code before producing the tables, correlations, regression, fitted values, residual diagnostics, and slideshow.
A new international data series
WORLD_BANK_SEARCH searches World Development Indicators. WORLD_BANK_CROSS_SECTION then retrieves an exact-year country cross section. The command is variadic: the first indicator is the outcome and every additional indicator becomes a predictor.
WORLD_BANK_SEARCH("GDP per capita")
development=WORLD_BANK_CROSS_SECTION(2023,"SP.DYN.LE00.IN","NY.GDP.PCAP.KD","IT.NET.USER.ZS")
slideshow(development)
slide(EXTRACT(development,source))
The three codes request life expectancy at birth, real GDP per capita, and individuals using the internet as a percentage of the population. The source returned 217 country or territory rows; 180 contained all three observations. Regional totals and income-group aggregates were excluded automatically.
The World Development Indicators dataset is especially useful for an open analytical platform because it is published under CC BY 4.0. RainbowStats preserves the dataset, indicator codes, observation year, update date, and attribution in an extractable source panel.
The startling first picture
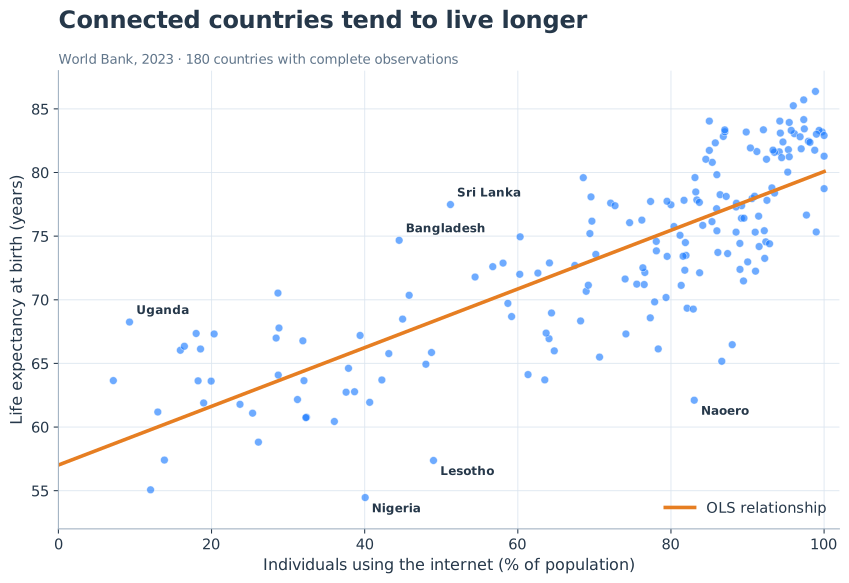
In the internet-only regression, each additional percentage point of the population online is associated with 0.232 years of life expectancy. A ten-percentage-point difference corresponds to roughly 2.3 years. The t-statistic is 18.176 and the model explains 64.9% of the observed cross-country variation.
That is an enormous relationship. It is also easy to misunderstand. Internet penetration bundles together electricity, communications infrastructure, education, urbanization, administrative capacity, access to health information, and the ability to afford connected devices. The variable may capture a country’s broader capacity to deliver modern services rather than an isolated benefit of web access.
Income matters—but not in a straight line
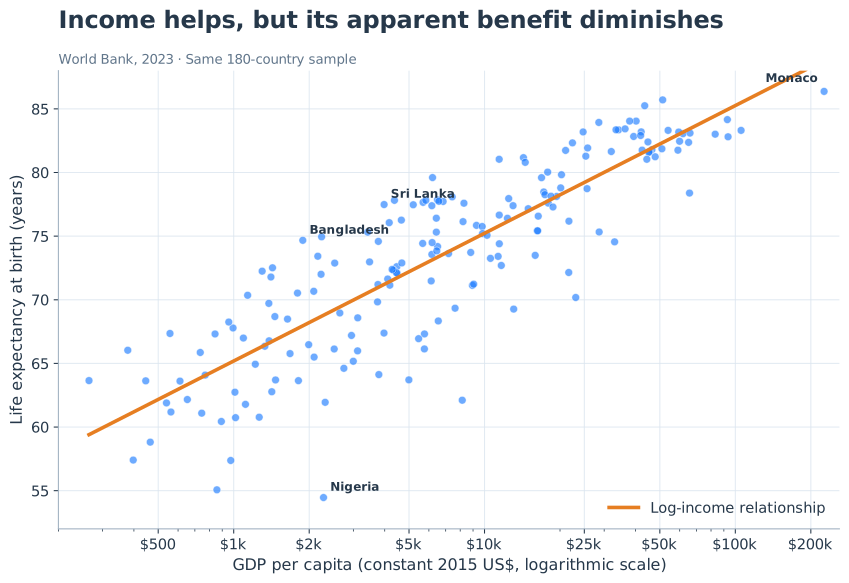
Real GDP per capita alone is highly significant, with a t-statistic of 11.323, but its linear specification explains only 38.9% of life-expectancy variation. The chart shows why the raw linear term is imperfect: an additional dollar matters much more in a poor country than in Monaco. The strange Monaco residual in the combined model is therefore diagnostic evidence of functional-form error, not merely an entertaining outlier.
Put income and connectivity in the same equation
| Model | Observations | Key coefficient | t-statistic | R² |
|---|---|---|---|---|
| GDP per capita only | 203 | Positive | 11.323 | 0.389 |
| Internet use only | 181 | 0.232 years per percentage point | 18.176 | 0.649 |
| GDP and internet | 180 | 0.189 years per internet point | 14.158 | 0.712 |
The individual models use every observation available for their variables. The chart below holds the sample fixed at the 180 countries complete in all three measures; its R² values are 0.386, 0.647, and 0.712.
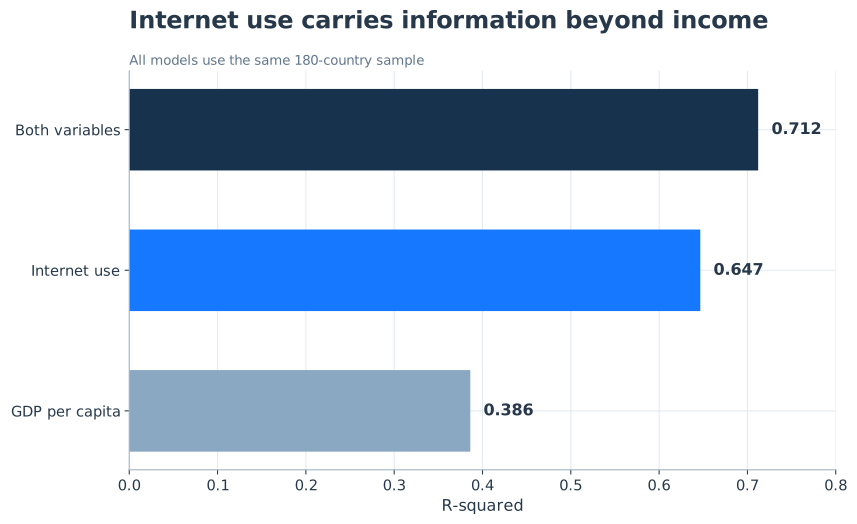
In the combined equation, a ten-point increase in internet use is associated with approximately 1.89 additional years of life expectancy while holding the linear GDP term constant. GDP also remains strongly significant, with a t-statistic of 6.349. Together the two variables explain 71.2% of the variation, with an adjusted R² of 0.709.
What about multicollinearity?
It is the right question. Richer countries usually have more connected populations, so GDP and internet use cannot be treated as unrelated pieces of information. Their 2023 correlation is 0.496. Adding GDP reduces the internet coefficient from 0.232 to 0.189, a decline of about 19%. Part of the internet-only relationship was clearly carrying income and the development structure that accompanies it.
| Diagnostic | Result | Interpretation |
|---|---|---|
| GDP–internet correlation | 0.496 | Meaningful overlap, but far from near-duplication |
| Variance inflation factor | 1.33 | Only modest inflation of standard errors |
| Internet t-statistic in combined model | 14.158 | The partial association remains very strong |
| GDP t-statistic in combined model | 6.349 | Income retains independent explanatory information |
So multicollinearity is present in the ordinary sense that two development measures move together, but it is not severe enough here to destabilize the equation. The larger concern is conceptual: both variables may be proxies for omitted systems—public health, clean water, education, state capacity, disease burden, conflict, and demographic structure. Low VIF does not establish causality.
The residuals tell the better stories
| Country or economy | Actual | Predicted | Residual |
|---|---|---|---|
| Naoero (Nauru) | 62.1 | 75.0 | −12.9 |
| Nigeria | 54.5 | 66.4 | −11.9 |
| Lesotho | 57.4 | 67.9 | −10.6 |
| West Bank and Gaza | 65.2 | 75.2 | −10.0 |
| Monaco | 86.4 | 96.2 | −9.8 |
| Kiribati | 66.5 | 75.4 | −8.9 |
| Sri Lanka | 77.5 | 68.6 | +8.9 |
| Uganda | 68.3 | 60.5 | +7.8 |
| South Africa | 66.1 | 73.9 | −7.7 |
| Bangladesh | 74.7 | 67.2 | +7.5 |
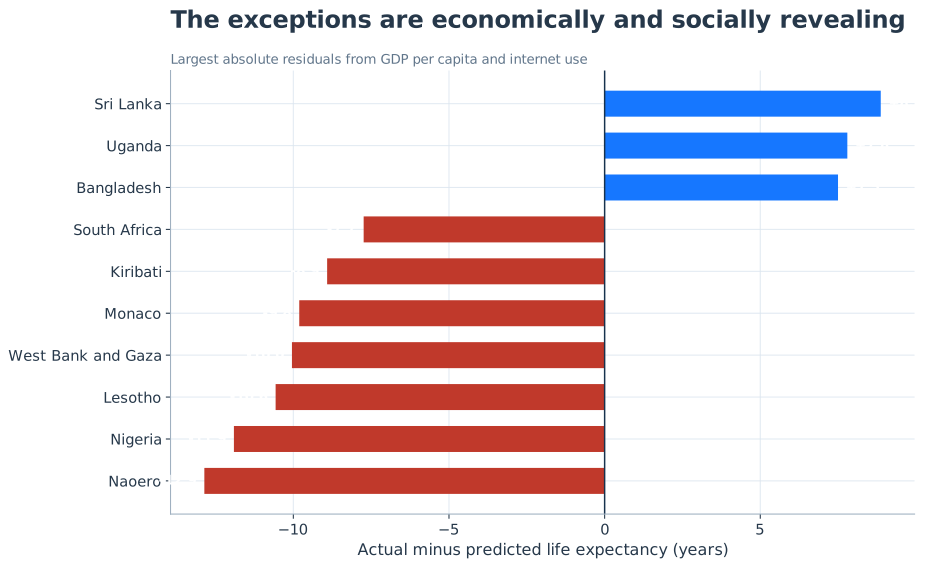
These are not errors to discard. They are invitations to investigate. Southern Africa’s negative residuals direct attention toward HIV/AIDS and inequality. Nigeria suggests limits in converting income and connectivity into broad health outcomes. Sri Lanka and Bangladesh point toward health gains achieved at comparatively modest income levels. West Bank and Gaza underscores how conflict and political conditions can overwhelm ordinary development relationships. Monaco exposes the inadequacy of extrapolating a linear income coefficient to an extreme value.
What this regression does—and does not—show
- It is cross-sectional. Countries differ in history, geography, institutions, age structure, disease exposure, and measurement practices.
- It is not causal. Longer-lived, richer, better-governed societies may build more internet infrastructure; internet use may also facilitate education and access to services. Both directions can operate.
- The income relationship is nonlinear. A logarithmic or quadratic income specification would be preferable to a raw linear term.
- Internet use is a compound proxy. It is entangled with electricity, schooling, urbanization, public administration, and household wealth.
- Missingness is not random. Thirty-seven returned rows lack at least one model value, and data availability can itself reflect institutional capacity.
The real showcase
The substantive finding is interesting. The workflow is the larger achievement. A user can search a vast international catalog, retrieve multiple indicators in one command, align them across countries, audit missingness, estimate a regression, inspect correlation and residuals, and carry the complete analysis into a slideshow. The source and redistributable license travel with the result.
Perhaps through some channels, but this regression cannot answer that causal question. What it can say is that connectivity is one of the strongest observable markers of the development systems associated with long life—and that it retains substantial information even after a simple income control.
That is enough to justify the next model. Publish, then investigate.
Replication
Open the live RainbowStats replication to run, inspect, or edit the complete analysis. Every command is kept on one line for easy editing.
WORLD_BANK_SEARCH("GDP per capita")
gdp_only=WORLD_BANK_CROSS_SECTION(2023,"SP.DYN.LE00.IN","NY.GDP.PCAP.KD")
slide(EXTRACT(gdp_only,regression))
internet_only=WORLD_BANK_CROSS_SECTION(2023,"SP.DYN.LE00.IN","IT.NET.USER.ZS")
slide(EXTRACT(internet_only,regression))
development=WORLD_BANK_CROSS_SECTION(2023,"SP.DYN.LE00.IN","NY.GDP.PCAP.KD","IT.NET.USER.ZS")
slide(EXTRACT(development,source))
slide(EXTRACT(development,correlation))
slide(EXTRACT(development,regression))
slide(EXTRACT(development,residuals))
slideshow(development)
Data: life expectancy, real GDP per capita, and internet use, World Development Indicators. Observation year 2023; World Bank update reported by the API: July 13, 2026. Licensed under CC BY 4.0.