When the Federal Reserve raised its target rate by a quarter point on September 16, Bill Ackman posed a pointed question. If the payoff to intelligence is enormous, perhaps developers of computing capacity will keep investing despite higher rates. If higher financing costs then show up in prices, could a rate hike add to inflation rather than reduce it?
That argument has two separate empirical steps. First, is the AI buildout unusually insensitive to interest rates compared with other investment? Second, does the buildout or the cost of financing it increase economy-wide prices enough to dominate the contraction elsewhere? The first question has a striking picture. The second remains unanswered by the evidence we can assemble today.
A remarkable change inside one construction category
The Census Bureau places data centers within private office construction. We subtract that component from total private offices to make an “other office” comparator. Both lines below are current-dollar spending expressed at seasonally adjusted annual rates. They describe spending on buildings, not a head count of projects and not the total cost of chips, servers and other equipment.
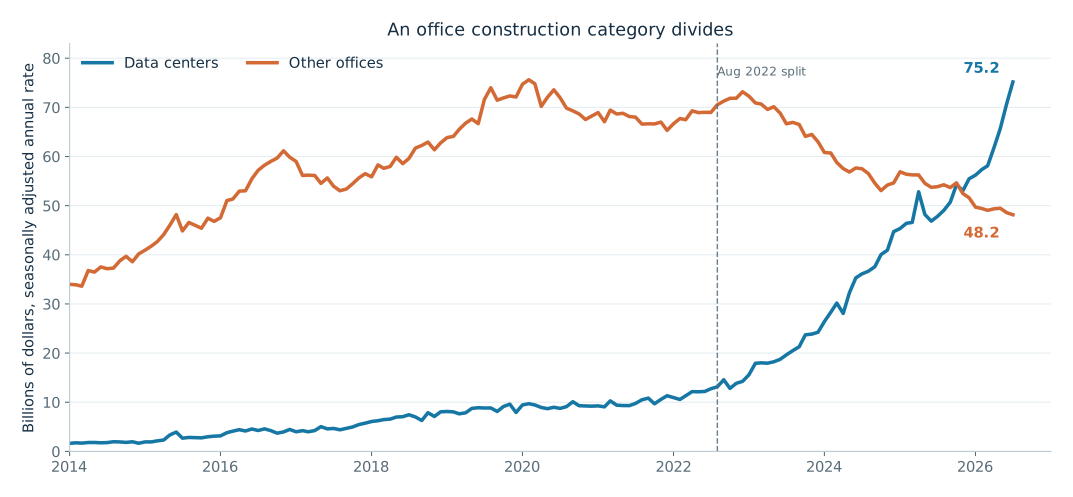
BINARY_SPLIT; it does not identify a cause. Source: Census private construction spending; other offices = office total − data centers.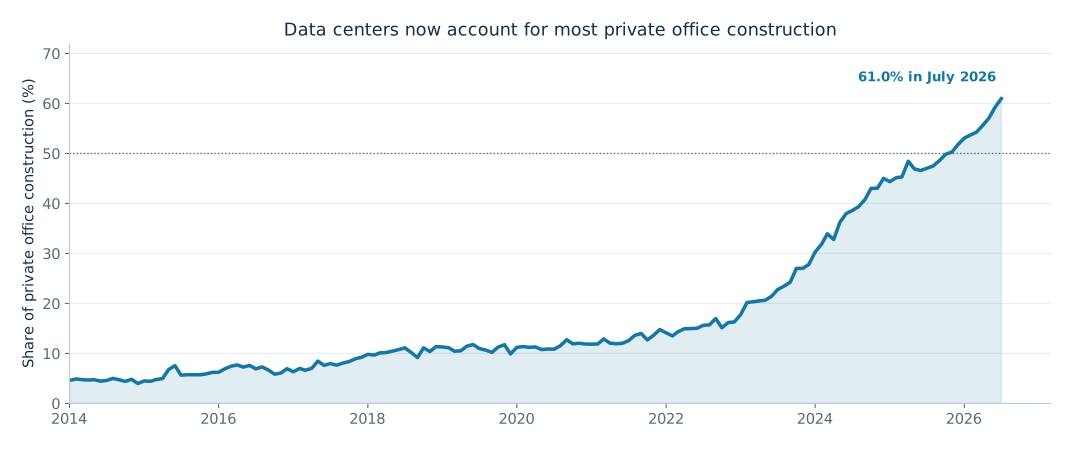
RainbowStats applies BINARY_SPLIT(dc,other) to the monthly levels. Its last segment starts in August 2022 and has a slope near −2.07: within that segment, months with more data-center spending tend to have less other-office spending. The segment's reported R² is 0.888. Both series also have strong time trends, so even that high fit is not an estimate of economic substitution. The search selected its own break date from these observations.
Nor does the construction series by itself measure all AI investment. Federal Reserve researchers note that data-center buildings precede the installation of computing equipment, and the physical structures are not the dominant source of data-center value. Equipment series include ordinary, non-AI computers. The construction numbers offer a useful window into the buildout, with a narrow field of view.
How does the growth gap relate to rates?
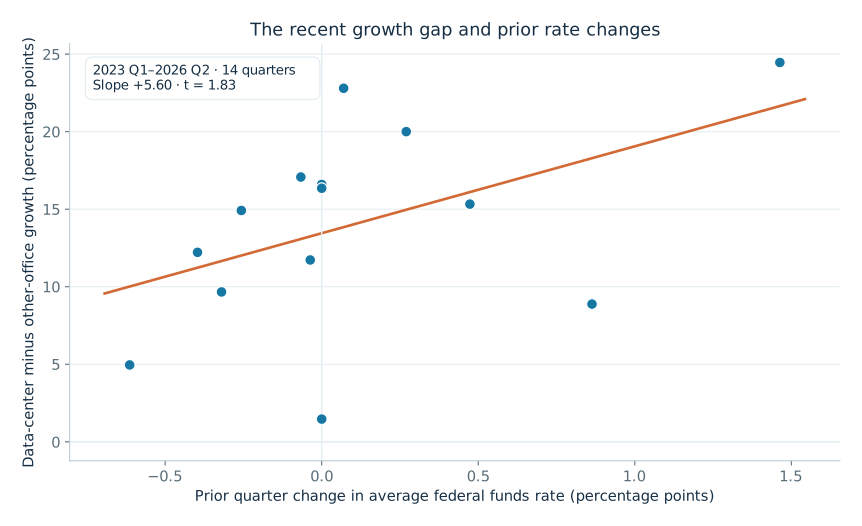
We average monthly spending into complete calendar quarters, use the same new industrial-building producer-price index as an approximate deflator for both categories, and take quarterly log growth. The interest-rate variable is the previous quarter's change in the quarterly average effective federal funds rate. The dependent variable in the recent-cycle test is data-center growth minus other-office growth.
| Quarterly outcome | Sample | Rate coefficient | Std. error | t | N |
|---|---|---|---|---|---|
| Real data-center construction growth | 2014 Q2–2026 Q2 | +2.45 | 3.39 | 0.72 | 49 |
| Real other-office construction growth | 2014 Q2–2026 Q2 | −0.40 | 1.58 | −0.25 | 49 |
| Data-center minus other-office growth | 2023 Q1–2026 Q2 | +5.60 | 3.06 | 1.83 | 14 |
Coefficients are percentage points of quarterly growth for a one-percentage-point increase in the prior quarter's average policy rate change. Standard errors and t statistics are the conventional RainbowStats regression output. The 14-quarter specification has limited power and does not use an exogenous monetary-policy shock.
The full-sample coefficients are imprecise. In the short period beginning in 2023, the positive 5.60-point estimate is consistent with an unusually resilient data-center sector, but its conventional t statistic is 1.83. That is suggestive, not decisive. The office downturn may also reflect demand for traditional workplaces; the comparison is not a controlled experiment.
A second BINARY_SPLIT in the live script applies monthly growth in the data-center/other-office ratio to a three-month lag of the funds-rate change. It finds a late-2022 segment, but its within-segment R² is only about 0.055. The level split makes the shift in construction mix vivid; the growth-rate check gives little evidence of a stable rate relationship.
What about Ackman's inflation mechanism?
The Fed could face a stronger electricity demand shock as data centers expand. The Energy Information Administration expects data-center load to be a major driver of long-run electricity growth. A mechanism can be economically plausible without yet showing up as a reliable national inflation coefficient.
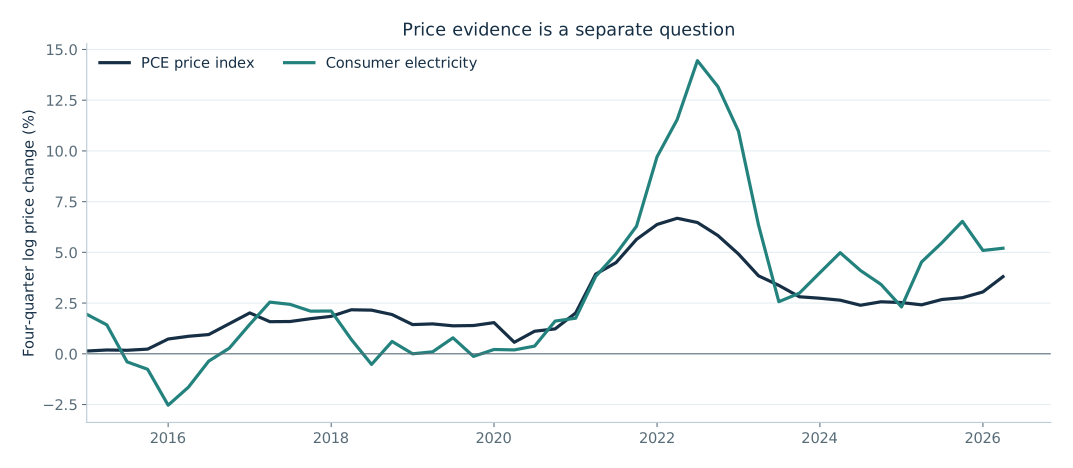
We separately regress quarterly PCE inflation and consumer electricity inflation on the prior rate change, contemporaneous data-center construction growth and commercial-electricity producer-price inflation. In these small national models, the construction coefficient is not distinguishable from zero:
| Price outcome | Data-center growth coefficient | Std. error | t | N |
|---|---|---|---|---|
| Quarterly PCE inflation | −0.0011 percentage points | 0.0074 | −0.15 | 49 |
| Quarterly consumer electricity inflation | −0.015 percentage points | 0.018 | −0.82 | 49 |
For a one-percentage-point increase in quarterly data-center construction growth, conditional on the other included variables. The price tests use contemporaneous quarterly associations; delayed pass-through and local effects remain possible.
The answer to the original question: one sector's ability to keep investing through higher rates is credible and worth studying. Our evidence does not establish Ackman's next step: that higher rates themselves raise aggregate inflation enough to force a self-reinforcing series of hikes. This data also cannot judge the September 2026 hike because it precedes that decision.
What this analysis establishes
The composition of office construction changed dramatically. RainbowStats finds a break near 2022, and a short recent regression shows a positive association between prior rate increases and the data-center growth advantage.
What would settle more
Regional grid loads and tariffs, individual data-center openings, financing exposure, office vacancy trends, and identified monetary-policy shocks would help separate AI demand, ordinary office weakness, interest costs and consumer-price pass-through.
Methods and evidence appendix
1. Data and definitions
The Census Bureau's monthly private construction workbook provides the Office and Data center series. Our “other office” series is Office − Data center, with both measured in millions of current dollars at seasonally adjusted annual rates. The public JSON snapshot holds 151 monthly observations per series from January 2014 through July 2026. July is a single month in the incomplete third quarter, so complete-quarter regressions end at 2026 Q2.
2. Transformations and models
RainbowStats READ_JSON_SERIES loads the named series. AGGREGATE_TO_PERIOD(...,QUARTERLY,MEAN) takes calendar-quarter means. The construction-growth proxy uses the FRED new industrial-building construction PPI as an imperfect price adjustment for both sectors. That common deflator cancels in the difference of the two growth rates.
rate changeq−1 = FEDFUNDSq−1 − FEDFUNDSq−2
growth gapq = growthdata centers,q − growthother offices,q
The simple construction regressions use an intercept and lagged rate change. The price models use an intercept, lagged rate change, contemporaneous data-center growth and commercial-electricity PPI growth. All reported table standard errors are the software's conventional estimates. Serial correlation, policy endogeneity and data-selected breaks deserve further work. The recent-sector regression contains only 14 observations.
3. The break diagnostic
BINARY_SPLIT recursively searches dates that reduce the residual error of a bivariate regression. Its level-data regime beginning in August 2022 is an exploratory marker. With two trending series, a high R² or negative contemporaneous slope may arise even without a causal diversion of financing or land. Neither the split date nor automatically attached news events identify an exogenous policy shock.
4. Sources and replication
- U.S. Census Bureau, Value of Construction Put in Place, Private SA workbook; monthly construction release.
- Federal Reserve, September 16, 2026 FOMC statement: target range raised by one-quarter point to 3¾–4%.
- Federal Reserve FEDS Note on the AI buildout: discusses what construction and equipment proxies measure and miss.
- FRED: FEDFUNDS, construction PPI, PCEPI, electricity CPI, and commercial-electricity PPI.
- EIA, Annual Energy Outlook 2026 release on projected data-center electricity demand.
- Run Bill Igoe's corrected, published RainbowStats script. The script imports the hosted JSON, displays charts and regression diagnostics, and includes its own source slides.
Discussion record: Read how Bill and ChatGPT developed and tested this analysis. This edited record summarizes the conversation; it is not a verbatim transcript.