Erica York’s discussion of labor-share measurement raises a deceptively simple problem: proprietors’ income combines returns to labor and capital, yet the national accounts cannot directly observe how much belongs to each factor.
The composition problem
A proprietor can be both worker and owner. A farmer, physician, consultant, contractor or small-business owner contributes labor while also earning a return on invested capital. Treating every dollar of proprietors’ income the same way across nearly eight decades therefore embeds an economic assumption inside what looks like an accounting convention.
The historical composition changed dramatically. Farm proprietors represented roughly 35–45% of proprietors’ income around the early postwar period, but only a few percent in recent decades. That makes a fixed postwar allocation rule worth stress-testing.
Let the data choose — inside economic bounds
RainbowStats estimates a median, or least-absolute-deviation, regression connecting the published wage-and-salary share with compensation, farm proprietors’ income and nonfarm proprietors’ income. Compensation is fixed at one. Farm and nonfarm allocation coefficients are constrained between zero and one.
The key extension is historical: both proprietor coefficients may take different effective values during 1948–1979 while the model retains the entire 77-observation sample.
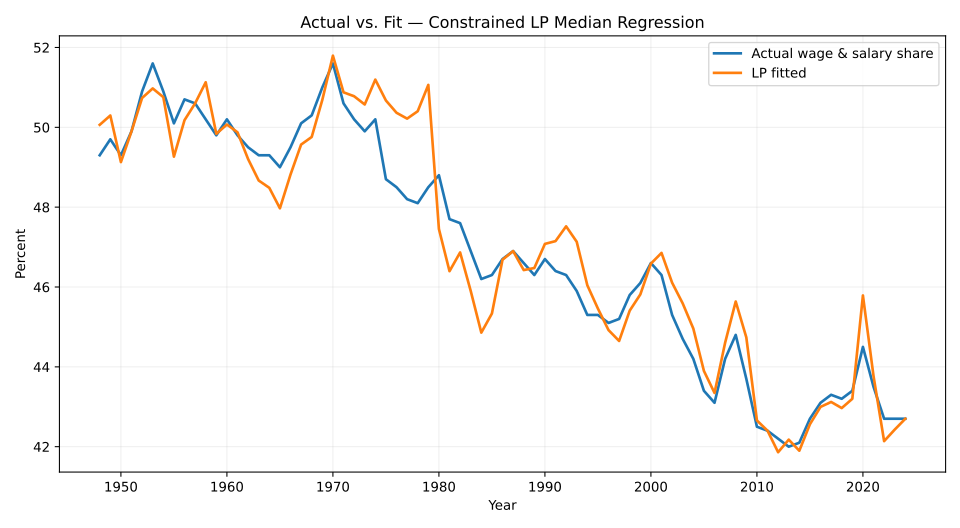
Figure 1. Actual wage-and-salary share versus the fitted values from the constrained q=0.5 LP regression. The model uses nine total constraints, including four period constraints.
The result
| Proprietors’ income component | 1980 onward | 1948–1979 effective | Difference |
|---|---|---|---|
| Farm treated as labor | 83.4% | 69.1% | −14.3 pp |
| Nonfarm treated as labor | 27.5% | 89.5% | +61.9 pp |
The surprise is not farming. The largest estimated regime difference is in nonfarm proprietors’ income. For purposes of reconciling these series, the constrained model assigns roughly 89% of early-postwar nonfarm proprietors’ income to labor, compared with about 28% in the later period.
Actual, fitted and residual behavior
The fitted series follows the broad postwar movement closely, but the residuals also show where the accounting reconciliation is imperfect. That imperfection is useful: it prevents a good statistical fit from being mistaken for an accounting identity.
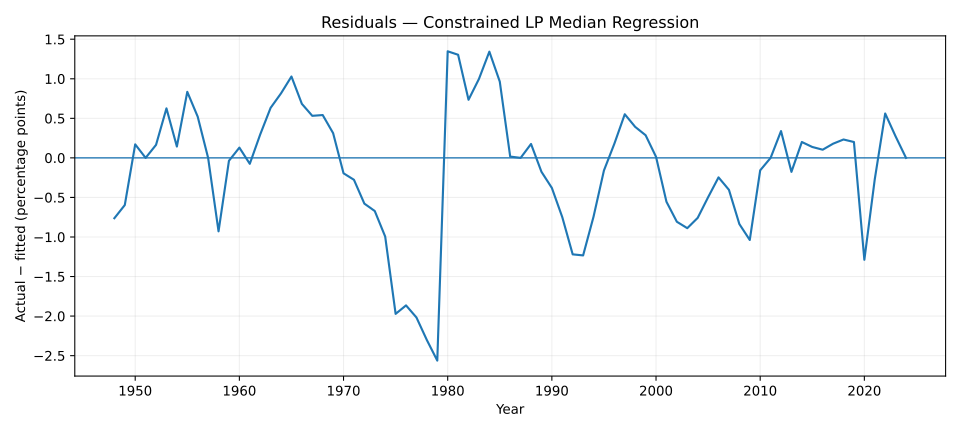
Figure 2. Residuals from the constrained LP median regression, measured as actual minus fitted percentage points.
LP regression summary
| Status | Optimal |
|---|---|
| Quantile | 0.50 (median / LAD) |
| Observations | 77 |
| Total constraints | 9 |
| Period constraints | 4 |
| Primal objective | 23.1907 |
| Mean absolute error | 0.6024 |
| R² | 0.9194 |
| Adjusted R² | 0.9112 |
What the experiment shows
The exercise does not establish one uniquely correct measure of labor’s share, nor does it determine why labor’s share changed. It demonstrates something narrower: a constant allocation of proprietors’ income across the entire postwar period is a substantive assumption, and the data strongly prefer different historical relationships when allowed to do so within economically meaningful bounds.
The changing importance of farming matters, but the result suggests a broader transformation in the organization of American work and business ownership. A dollar classified as proprietors’ income need not represent the same mixture of human effort and invested capital in 1955 that it represents today.
ADD_LP_EQUATION_RANGE. The objective is median regression, minimizing absolute deviations rather than squared errors.The broader lesson
Long economic time series can appear precisely measured while embedding assumptions whose economic meaning changes over time. Consistency of accounting treatment does not guarantee consistency of economic meaning.
Before drawing strong conclusions from a 75-year movement in labor’s share, it is worth asking whether the income being classified retained the same economic meaning for 75 years. This experiment suggests that assumption deserves considerably more scrutiny.
Replicate the analysis
The data retrieval, transformations, economic constraints and regression are contained in the RainbowStats script so the assumptions can be inspected and changed.
Run the RainbowStats analysis →