A national diesel balance is only the start of a policy analysis. The United States may refine more distillate than it uses, yet a barrel at a Gulf Coast export terminal cannot automatically fill a tank in New England. We used the newly published RainbowStats plugin to follow that distinction from live data to an explicit optimization model.
1. The first question tested the plugin
“Analyze U.S. payroll growth and unemployment since 2021 with charts and a concise regression.”
RainbowStats pulled the FRED PAYEMS and UNRATE series, drew their histories, and regressed the monthly change in unemployment on monthly payroll growth. In that run, an additional 100,000 payroll jobs was associated with a roughly 0.03 percentage point lower monthly change in unemployment; R² was 0.222 over 65 observations. That is an association between two different labor-market surveys, not a causal estimate. The exercise established the workflow: ask, retrieve, graph, estimate, and inspect the underlying script.
2. The question moved to diesel
“The president wants to ban diesel exports. Analyze U.S. domestic production, consumption and exports of diesel.”
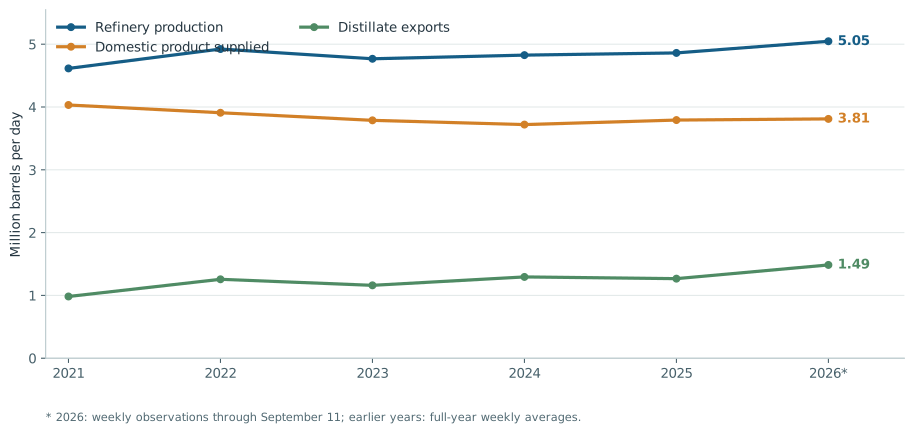
We used EIA distillate fuel oil, chiefly diesel but also including heating oil. EIA's product supplied is a proxy for domestic consumption. The figures below are our averages of the weekly EIA series; 2026 ends September 11 and is not a full-year average. For policy context, the export restriction was being discussed, not treated here as enacted. EIA explains the product category and export destinations.
| Million barrels/day | 2021 | 2025 | 2026 to Sept. 11 |
|---|
| Refiner net production | 4.61 | 4.86 | 5.05 |
| Domestic product supplied | 4.03 | 3.79 | 3.81 |
| Distillate exports | 0.98 | 1.27 | 1.49 |
Production rose, domestic product supplied remained near 3.8 million barrels per day, and exports increased. The latest four-week export average available in our plugin run was 1.67 million barrels per day. Yet these national totals cannot tell us whether restricting exports would put fuel where American buyers need it.
3. Where are the barrels?
“Is there data on the possible transit bottlenecks?”
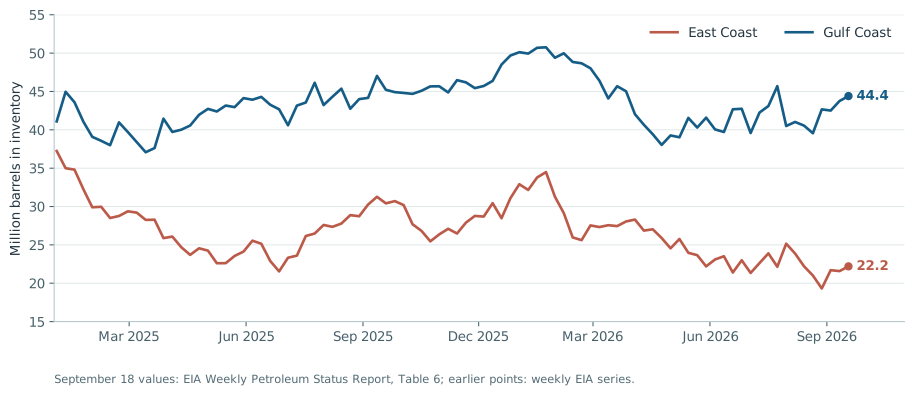
Yes. EIA publishes weekly stocks by region and monthly interregional movements by pipeline and vessel. Its September 18 report puts East Coast distillate stocks at 22.2 million barrels, down 27.1% from the comparable week a year earlier. Gulf Coast stocks were 44.4 million, down only 1.8%. The East Coast was short by 8.2 million barrels relative to its year-earlier 30.4 million level. A 30-day exercise that restores that entire difference would require about 0.27 million additional barrels per day delivered and held on the East Coast. The difference is an illustrative target, not an EIA forecast of required stocks. Source: EIA Weekly Petroleum Status Report, Table 6.
In June, the latest complete month in this exercise, EIA recorded 18.453 million barrels moving Gulf-to-East by pipeline, or about 615,000 per day, plus 4.532 million by tanker and barge, or about 151,000 per day. These are observed flows. They are not spare capacities or proof that a route is currently binding. Colonial carries gasoline and jet fuel as well as diesel; EIA has described frequent capacity allocations. Coastal deliveries between U.S. ports also require eligible vessels under the Jones Act. Pipeline receipts · Vessel movements · EIA on Colonial allocations · MARAD on the Jones Act.
4. First LP: can a ban force a barrel through a full route?
“This might turn into an interesting linear programming exercise.”
RainbowStats' LINEAR_LP command family creates nonnegative continuous decision variables, accepts equality and capacity constraints, and reports the solution and binding limits. We first solved a deliberately small physical ceiling example. Its objective strongly prioritized domestic demand before exports. With the assumed pipeline and vessel routes filled, the open-export solution sent 0.30 million barrels per day east and left 0.30 of East demand unmet. Setting permitted exports to zero left East deliveries unchanged: 0.10 went into storage and 0.40 into modeled output curtailment. Raising the assumed pipeline limit from 0.20 to 0.40 increased East deliveries to 0.50 and reduced unmet demand to 0.10.
The first result: An export prohibition changes the feasible sales channel. It does not create transport capacity. Under a domestic-first objective with saturated routes, the model shifts the blocked barrels into storage and curtailed production.
See the exact first model and its assumptions
All volumes are million barrels per day. The hypothetical 1.00 supply pool serves a 0.20 Gulf commitment (H) and a 0.60 East target (P+V), with the unmet East portion U. S is storage, E exports, and C curtailed output. The pipeline, vessel, storage and export limits are assumptions, not EIA capacity estimates. The objective weights are illustrative points.
LP=LINEAR_LP(PHYSICAL_OPEN)
ANS=ADD_LP_EQUATION(LP,P+V+H+S+E+C=1.00)
ANS=ADD_LP_EQUATION(LP,P+V+U=0.60)
ANS=ADD_LP_EQUATION(LP,H=0.20)
ANS=ADD_LP_EQUATION(LP,P<0.20)
ANS=ADD_LP_EQUATION(LP,V<0.10)
ANS=ADD_LP_EQUATION(LP,S<0.10)
ANS=ADD_LP_EQUATION(LP,E<0.80)
ANS=SET_LP_OBJECTIVE(LP,P+3*V+100*U+20*C-10*E)
ANS=MIN_LP(LP)
LPT=MODEL_LP(LP)
Final_LP=LP
Set E<0 for the ban. To test more route room, also change P<0.20 to P<0.40. The three complete scripts are provided in scripts/physical_*.rstats.
5. Next version: an incremental export pool
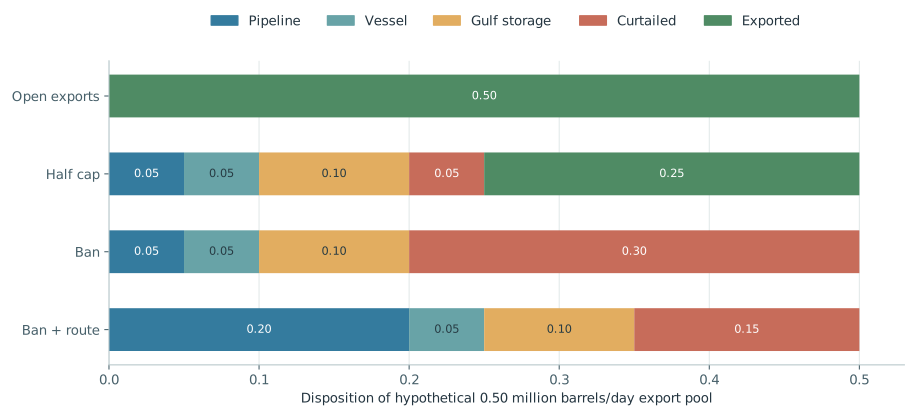
The first model already sent every barrel it could to domestic buyers before any restriction. For a sharper policy test, the next version asks what happens to a hypothetical 0.50 million barrel/day pool that could otherwise be exported. This is a scenario tranche, not an estimate of Gulf Coast exports or a claim that every exported barrel is movable. We set an East Coast restocking target of 0.27 million barrels/day, derived from the 8.2-million-barrel year-over-year gap over 30 days.
The model can send the pool east by pipeline (P) or vessel (V), add to Gulf storage (G), continue exporting (E), or curtail output from this modeled pool (C). U is the East restocking target left unmet. We assume incremental pipeline room of 0.05, vessel room of 0.05, and Gulf storage room of 0.10 million barrels/day for the 30-day exercise. None of these three room estimates is measured by EIA.
The objective assigns illustrative opportunity-cost weights of 1 to pipeline use, 3 to vessel use, 25 to unmet restocking, 15 to curtailed output, and a credit of 40 for continued export. They are abstract model points, not observed dollars, fuel prices, or welfare estimates. Their purpose is to make the choice between export revenue and restocking explicit. The same weights are held fixed in every scenario.
| Million barrels/day | Open | Half cap | Ban | Ban + route |
|---|
| Added East pipeline delivery | 0 | 0.05 | 0.05 | 0.20 |
| Added East vessel delivery | 0 | 0.05 | 0.05 | 0.05 |
| Added Gulf inventory | 0 | 0.10 | 0.10 | 0.10 |
| Exports from modeled pool | 0.50 | 0.25 | 0 | 0 |
| Modeled output curtailed | 0 | 0.05 | 0.30 | 0.15 |
| East restocking target unmet | 0.27 | 0.17 | 0.17 | 0.02 |
All four cases returned an optimal solution in RainbowStats. “Ban + route” changes the assumed incremental pipeline limit from 0.05 to 0.20 million barrels/day. The results are conditional on the stated supply tranche, targets, capacities, and objective weights.
What changed? Under the assumed tight routes, the ban diverts 0.10 million barrels/day to the East and 0.10 to Gulf storage, but 0.30 is curtailed. A half restriction achieves the same East delivery because both assumed routes have reached their limits; it preserves 0.25 of exports and reduces curtailment to 0.05. With more assumed pipeline room, the full-ban case delivers 0.25 east and curtails 0.15. This is the distinction between barrels prohibited from leaving and barrels delivered to domestic buyers.
RainbowStats marks pipeline, vessel, and storage limits as binding in the restricted cases. The shadow value of more route room can be checked by raising a capacity limit slightly and resolving, as its LP reference recommends. Because the weights are illustrative, that shadow value is a sensitivity measure in model points, not a credible dollar price.
See the exact tested ban script
LP=LINEAR_LP(DIESEL_BAN)
ANS=ADD_LP_EQUATION(LP,P+V+G+E+C=0.50)
ANS=ADD_LP_EQUATION(LP,P+V+U=0.27)
ANS=ADD_LP_EQUATION(LP,P<0.05)
ANS=ADD_LP_EQUATION(LP,V<0.05)
ANS=ADD_LP_EQUATION(LP,G<0.10)
ANS=ADD_LP_EQUATION(LP,E<0)
ANS=SET_LP_OBJECTIVE(LP,P+3*V+25*U+15*C-40*E)
ANS=MIN_LP(LP)
LPT=MODEL_LP(LP)
Final_LP=LP
Each command is on one line. The other three ready-to-run versions are in the accompanying scripts/ folder.
What we learned—and what remains to measure
The plugin made the sequence inspectable: a question produced sourced series; the regional question exposed geography; the LP made an assumption about spare transport capacity explicit. The conclusion is conditional but useful: a ban can trap barrels near their origin if domestic transport and storage cannot absorb them. The first physical-ceiling test showed no extra East delivery; the incremental version showed some, capped by assumed route room, while storage and curtailment absorbed the balance.
A policy estimate needs current pipeline allocation notices, available coastwise vessel capacity, terminal working storage, Gulf Coast export origin by product specification, and a defensible price or welfare objective. Monthly EIA shipments and weekly stocks are observable. They do not reveal all of those missing capacities. The next model should also add multiple months, seasonal heating demand, refinery response, and shared pipeline space with gasoline and jet fuel.
Replication: Run each supplied .rstats script separately in RainbowStats. The package also includes the EIA data used for both historical charts, the monthly pipeline series, scenario outputs, and SVG graphics. All model quantities beyond the linked EIA observations are explicitly labeled assumptions.