The finding
Regression residuals are often treated as debris left behind after the coefficients have been estimated. In this analysis, the debris is the most interesting part. The counties with far more general-freight trucking employment than our simple model predicts contain major carriers or sit at unusually powerful freight locations.
RainbowStats retrieved the Bureau of Labor Statistics’ 2025 annual Quarterly Census of Employment and Wages records for industry 4841—General freight trucking. It resolved county FIPS codes, selected comparable private-sector observations, screened unusable records, estimated the county regression and labeled its largest residuals.
From search to model
The analysis begins without requiring the user to know the correct industry code. The registry search translates a plain-language subject into the BLS classifications available for analysis.
QCEW_SEARCH("trucking")| Code | QCEW industry returned by the search |
|---|---|
4841 | General freight trucking |
48411 | General freight trucking, local |
484110 | General freight trucking, local |
48412 | General freight trucking, long-distance |
484121 | General freight trucking, long-distance, truckload |
484122 | General freight trucking, long-distance, less than truckload |
4842 | Specialized freight trucking |
48422 | Specialized freight (except used goods) trucking, local |
484220 | Specialized freight (except used goods) trucking, local |
48423 | Specialized freight (except used goods) trucking, long-distance |
484230 | Specialized freight (except used goods) trucking, long-distance |
We selected 4841. It is broad enough to preserve a national county sample while remaining economically coherent. Using code 10 would combine every industry and obscure the geography we are trying to understand.
# Discover, download and analyze general freight trucking
QCEW_SEARCH("trucking")
qcew=QCEW(2025,ANNUAL,"4841")
slide(qcew)
cross=EXTRACT(qcew,cross_section)
slide(cross)

# Smaller analytical panels can also be requested directly
slide(EXTRACT(cross,regression))
slide(EXTRACT(cross,outliers))
The data RainbowStats assembled
The source file includes multiple geographic levels, ownership categories, establishment-size classes and disclosure states. RainbowStats retains recognized counties, the all-size category, unsuppressed observations and one consistent ownership class. For this industry it selected private ownership code 5.
A deliberately simple regression
The model asks how trucking employment varies with the number of trucking establishments and the industry’s average weekly wage in each county:
| Term | Coefficient | Std. error | t-statistic |
|---|---|---|---|
| Constant | −8.531 | 0.627 | −13.613 |
| Log establishments | 1.159 | 0.016 | 72.339 |
| Log average weekly wage | 1.393 | 0.090 | 15.467 |
The establishment coefficient is an elasticity: conditional on wages, a 1% increase in establishment count is associated with roughly 1.16% more employment. The wage coefficient is also positive and precisely estimated, but it should not be read causally. Wage can proxy for carrier scale, urban cost, route mix, labor scarcity and other omitted conditions.
An (R^2) near 0.80 is substantial for a national county cross-section. Yet it is the remaining 20%—the counties far from the diagonal—that reveals the industrial geography.
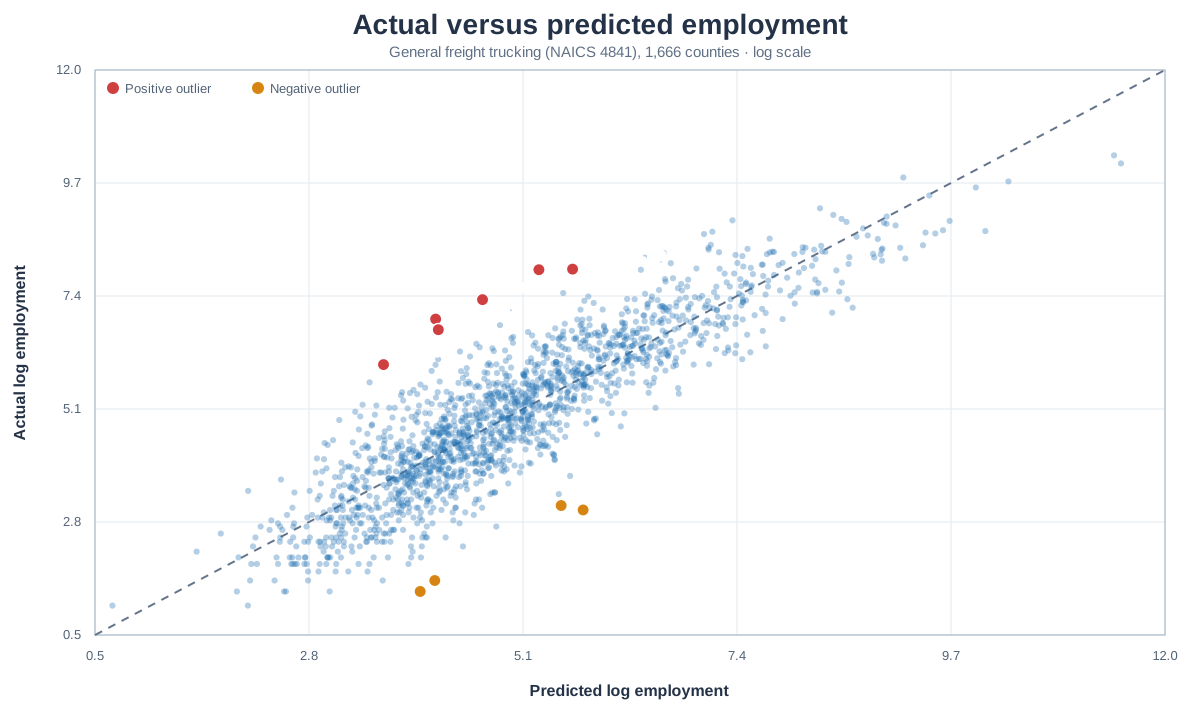
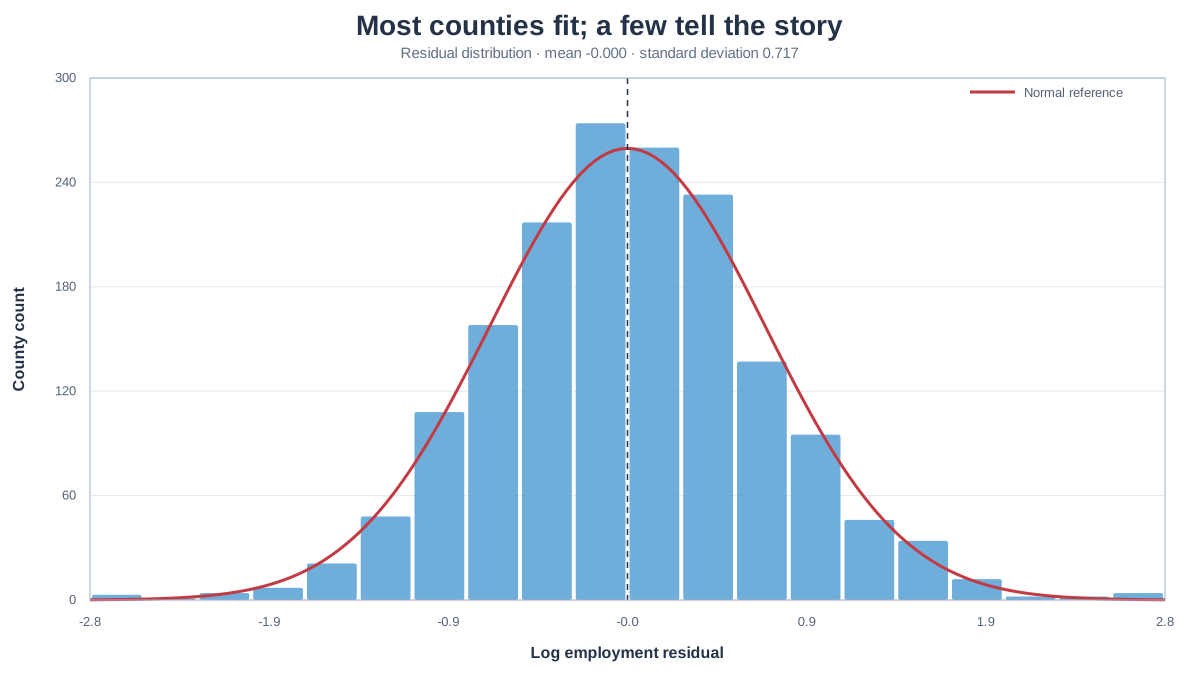
The model’s biggest misses
Because the outcome is logarithmic, exp(residual) converts each residual into an intuitive ratio: actual employment divided by predicted employment. A residual of 2.77 means roughly sixteen times the predicted employment; a residual of −2.70 means only about 7% of the prediction.
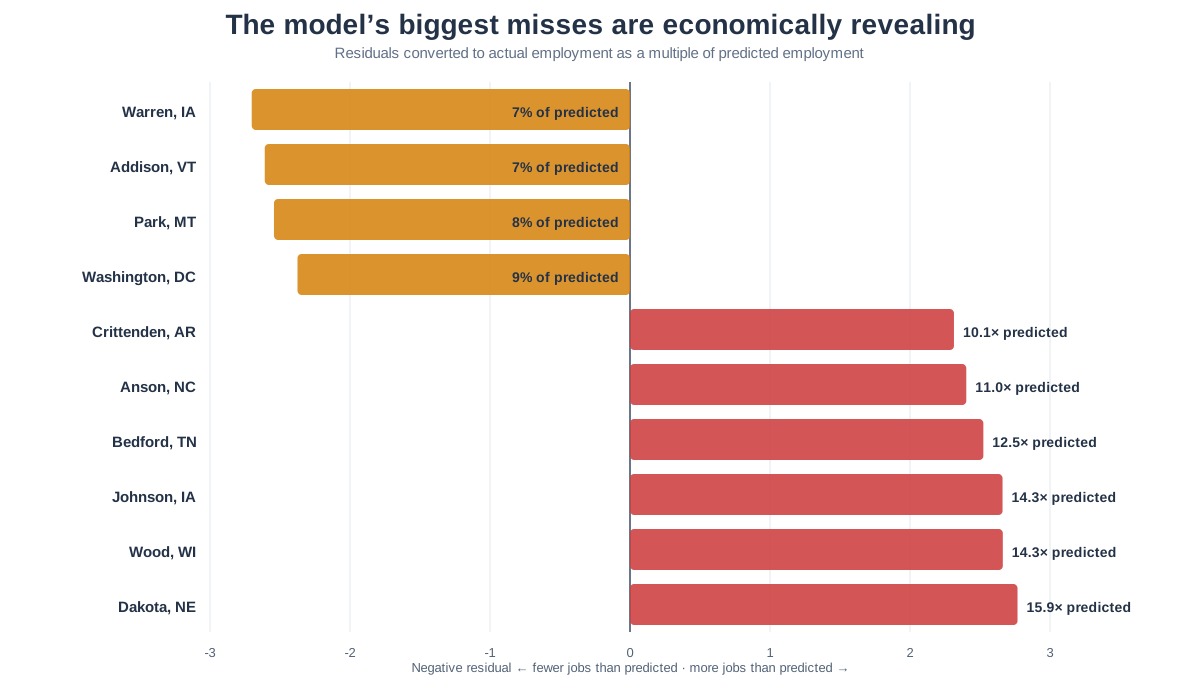
| County | Actual jobs | Predicted | Actual ÷ predicted | Interpretation |
|---|---|---|---|---|
| Dakota, NE | 1,022 | 64 | 15.9× | Likely reflects the South Sioux City carrier and terminal cluster within the larger Sioux City freight economy. |
| Wood, WI | 2,793 | 195 | 14.3× | Marshfield is the corporate headquarters and a major terminal of Roehl Transport. |
| Johnson, IA | 1,519 | 106 | 14.3× | Heartland Express is headquartered in North Liberty; its national carrier operation is unusually large relative to the local establishment count. |
| Bedford, TN | 824 | 66 | 12.5× | Big G Express, an asset-based truckload carrier, is headquartered in Shelbyville. |
| Anson, NC | 405 | 37 | 11.1× | Likely a small number of large operations along the US-74 and CSX freight corridor; establishment-level confirmation would be useful. |
| Crittenden, AR | 2,827 | 279 | 10.1× | West Memphis combines I-40, I-55, rail, port and intermodal access—a genuine freight-hub effect. |
| Warren, IA | 21 | 313 | 7% of predicted | Very thin reported employment despite predictors associated with a much larger operation; nearby-metro boundaries and small reporting units may matter. |
| Addison, VT | 4 | 54 | 7% of predicted | A handful of jobs spread across small establishments; the national scale relationship does not fit this rural market. |
| Park, MT | 5 | 64 | 8% of predicted | Another extremely small local industry where establishment count and wage do not translate into a conventional carrier workforce. |
| Washington, DC | 23 | 247 | 9% of predicted | High-cost offices can exist in the District, but terminals, yards and drivers are more naturally located in surrounding jurisdictions. |
Job counts are approximate because the displayed log values were exponentiated and rounded.
Why these counties?
Headquarters create employment concentration
Wood County and Johnson County are the cleanest validations. Roehl identifies Marshfield as its corporate headquarters and a terminal. Heartland Express identifies North Liberty as its Iowa headquarters; the FMCSA carrier snapshot lists thousands of power units and drivers nationally. Bedford County offers a third example: Big G Express describes itself as an asset-based carrier headquartered in Shelbyville.
The model knows only how many establishments a county reports and what those establishments pay. It does not know that one establishment is the command center or principal terminal for a large interstate fleet. A headquarters county can therefore have far more employment per establishment than the national relationship predicts.
Freight infrastructure creates hub effects
Crittenden County is different but equally revealing. West Memphis sits at the convergence of I-40 and I-55 and has rail, port, truck and intermodal facilities. The city’s site-selection materials explicitly emphasize those connections and the depth of the Memphis logistics labor force. Trucking employment is not merely proportional to the number of local companies; the location itself concentrates freight activity.
Anson County is a more tentative inference. County development materials emphasize access to US-74 and regional transportation routes, while the Atlantic Gateway site combines direct US-74 access with an adjacent CSX line. Those facts make an employment concentration plausible, but the QCEW residual alone cannot identify the responsible employer. The correct next step would be establishment-level research, not a stronger causal claim.
Negative residuals reveal boundary and scale problems
The negative tail is not simply the mirror image of the positive tail. Warren County, Addison County, Park County and Washington, DC report only 4 to 23 jobs in this selected industry observation. Their establishment counts and wages make the national equation expect more, but a small administrative office, owner-operated business, metro-boundary effect or unusual reporting unit can break that relationship.
Washington is intuitive: expensive professional and administrative activity can be located in the District, while land-intensive terminals and truck yards locate outside it. The model sees the wage; it does not see the scarcity of industrial land.
What the tool contributed
Discovery
QCEW_SEARCH found the usable BLS industry hierarchy without requiring the analyst to memorize NAICS-style codes.
Acquisition
QCEW downloaded the public annual industry slice and normalized BLS’ annual fields into one record model.
Code resolution
The industry registry turned 4841 into a readable title, while the county registry replaced FIPS identifiers with county and state labels.
Comparable observations
RainbowStats removed suppressed rows, non-county geographies, duplicate ownership categories and incompatible establishment-size records.
Robust model construction
The cross-section screens constant and nearly perfectly correlated predictors before estimation, avoiding singular-matrix failures.
Interpretation
The residual table converted an abstract national regression into specific places that could be checked against real carriers and infrastructure.
What this analysis does not prove
- The wage coefficient is an association, not an estimate of wages causing trucking employment.
- QCEW is establishment-based administrative data. Headquarters, terminals and mobile workers can make a county’s reported employment different from where trucks spend their time.
- Industry 4841 combines local and long-distance general freight. A follow-up could estimate separate models for
48411,484121and484122. - Suppression is substantial in narrow county industries and is not random with respect to establishment size.
- An outlier identifies a question. External evidence is required before assigning it to a particular company or mechanism.
The next model could add interstate access, port and intermodal proximity, industrial land, population density and carrier-headquarters indicators. But the virtue of this first pass is its simplicity: with only establishments and wages, it already finds the geography of American trucking.
Data, replication and sources
Data: U.S. Bureau of Labor Statistics, Quarterly Census of Employment and Wages, 2025 annual data, industry 4841. See also the QCEW open-data documentation.
Company and location checks: Roehl Transport locations; Heartland Express terminals; FMCSA Heartland Express snapshot; Big G Express; West Memphis site-selection center; Anson County economic development.
Run the analysis: Open the RainbowStats script editor and paste the script shown above.