Europe, Unite!
Churchill’s vision, Putin’s strategy, and twenty-seven national interests
Data essay • Eurostat COMEXT • 2020–2025
Reproduce the charts: Open the RainbowStats script and slideshow. The saved script contains the five-country Sankey and line-chart comparisons; the full EU-27 network and 26-partner Sankey appear separately in the figures below.
Churchill’s unfinished question
In September 1946, Winston Churchill stood before an audience at the University of Zurich and urged Europeans to build “a kind of United States of Europe.” After two devastating wars, he understood that Europe needed more than declarations of friendship: it needed durable cooperation among states with different histories and interests. His speeches on European unity were later collected in Europe Unite.
Eight decades later, the European Union is an extraordinary achievement. Former enemies share a market and common institutions. But the EU is not a single sovereign republic. Its 27 member states retain distinct governments, resources, political priorities and national interests.
Russia’s invasion of Ukraine has exposed the difficulty of translating shared principles into uniform economic sacrifice. Ukraine is fighting an aggressor. Its European partners must agree not only on what they oppose, but also on what each is willing to pay.
Twenty-seven energy relationships
The European Union has acted collectively: sanctions, assistance to Ukraine and an ambitious effort to reduce Russian energy dependence. The European Commission reports that Russia’s share of EU gas imports fell from 45% in 2021 to 12% in 2025. That is significant progress, not a failure of solidarity.
Yet the economic burden differs by country. France has a substantial nuclear generating fleet; Germany completed its nuclear phaseout in April 2023. Hungary and Slovakia have had different pipeline options from coastal states. Belgium and the Netherlands operate important ports, refineries and energy-trading networks. Governments cannot replace decades of infrastructure with a declaration.
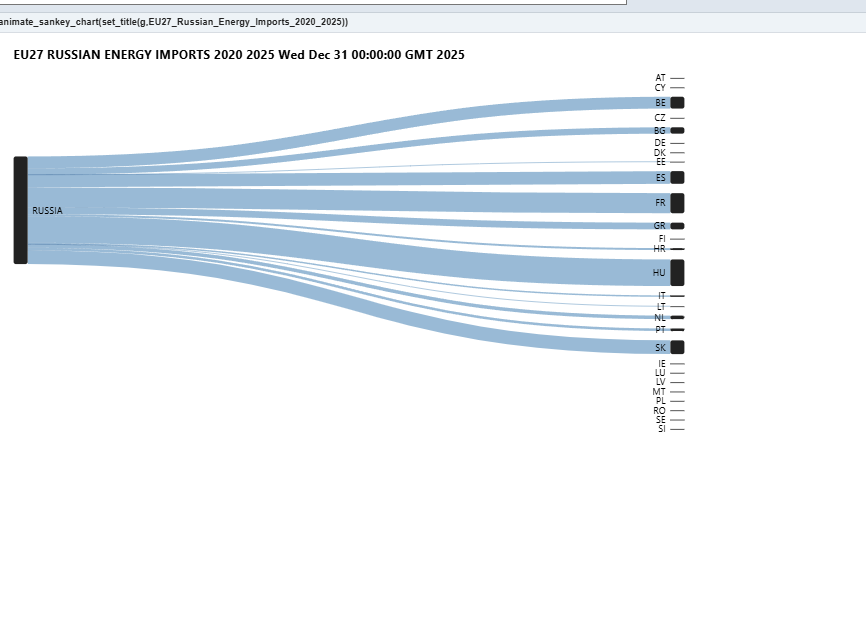
To see these differences, we used RainbowStats and Eurostat COMEXT to retrieve monthly reported imports of Russian mineral fuels by EU members from 2020 through 2025. Our first Sankey diagram connects Russia with all 27 countries. As the animation moves through the invasion and subsequent sanctions, many links contract; others persist.
Why two charts are better than one
The Sankey shows who is connected. A line chart shows when those relationships changed. The distinction matters: a December snapshot can conceal years of adjustment, volatility or recovery.
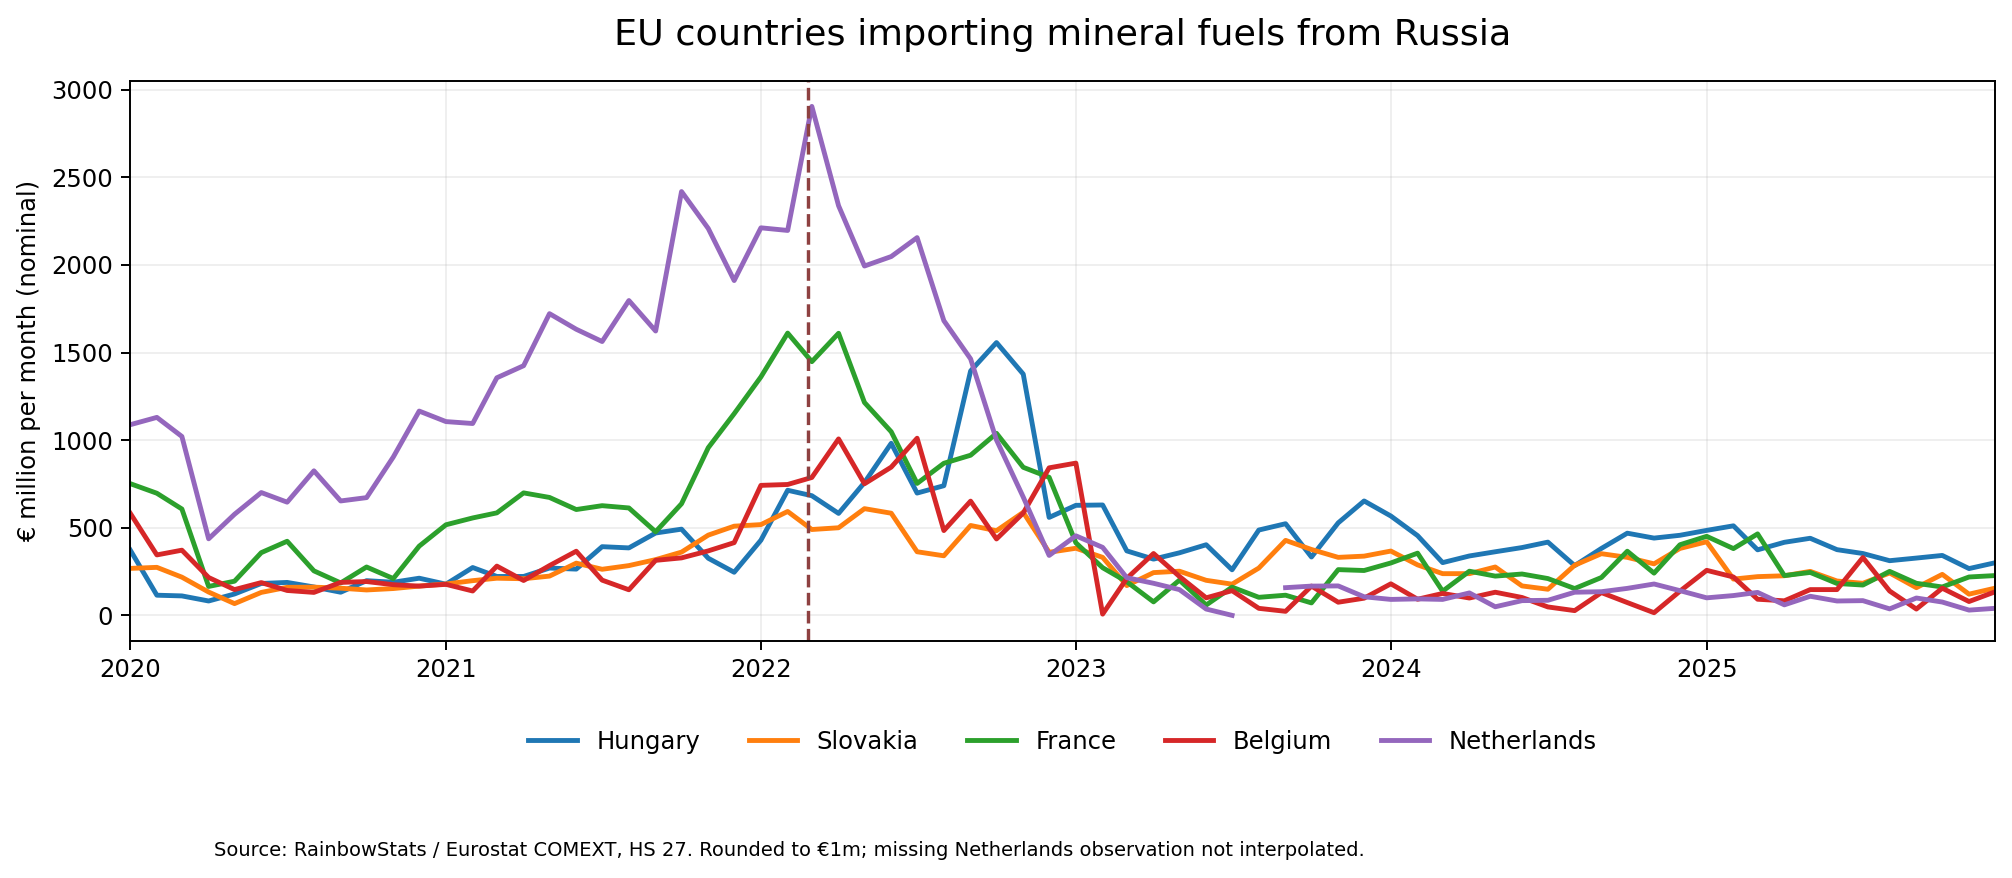
Our companion line chart follows Hungary, Slovakia, France, Belgium and the Netherlands month by month. The dramatic price shock around 2022 is visible, as are the very different subsequent trajectories. Hungary and Slovakia retain substantial reported import values in 2025, while the Netherlands and Belgium have much smaller direct Russian flows than at their 2022 peaks.
These are nominal euro values, not tonnes or energy content. Prices and commodity composition affect the lines, so they cannot alone measure physical dependence. Nor does a reported import prove a sanctions violation. But the combination of network and history reveals something neither chart can communicate alone: one union experienced several different economic transitions.
Germany and the European network
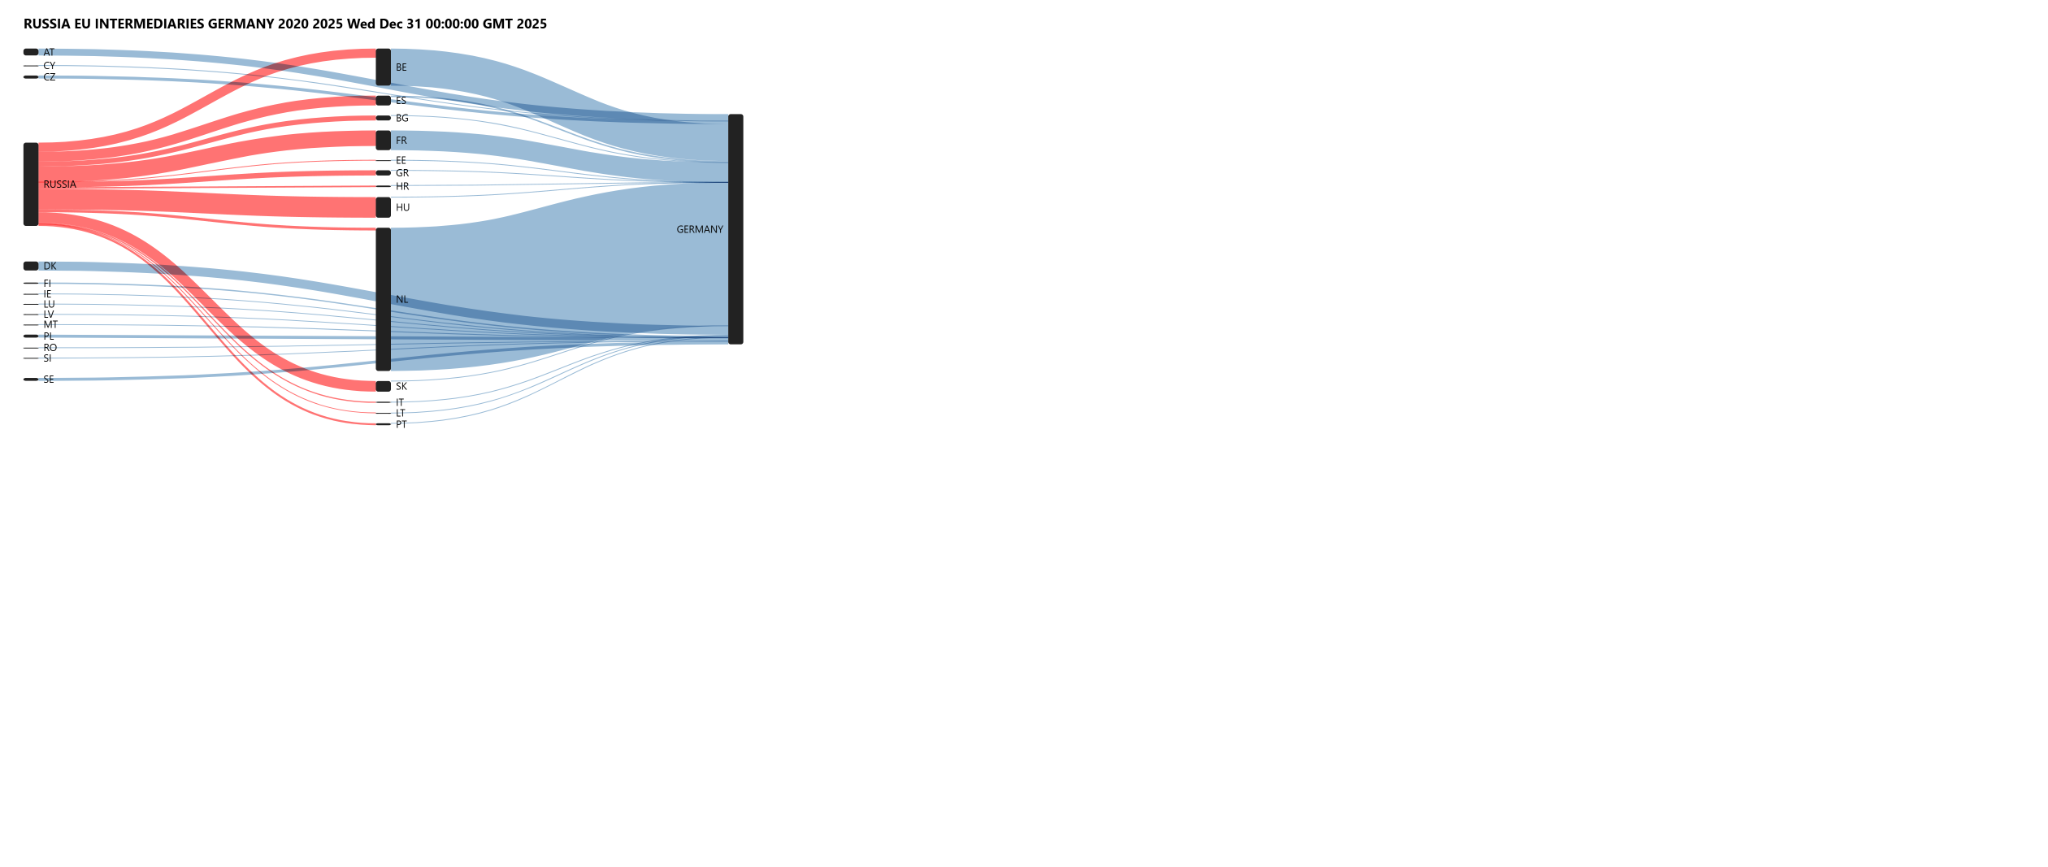
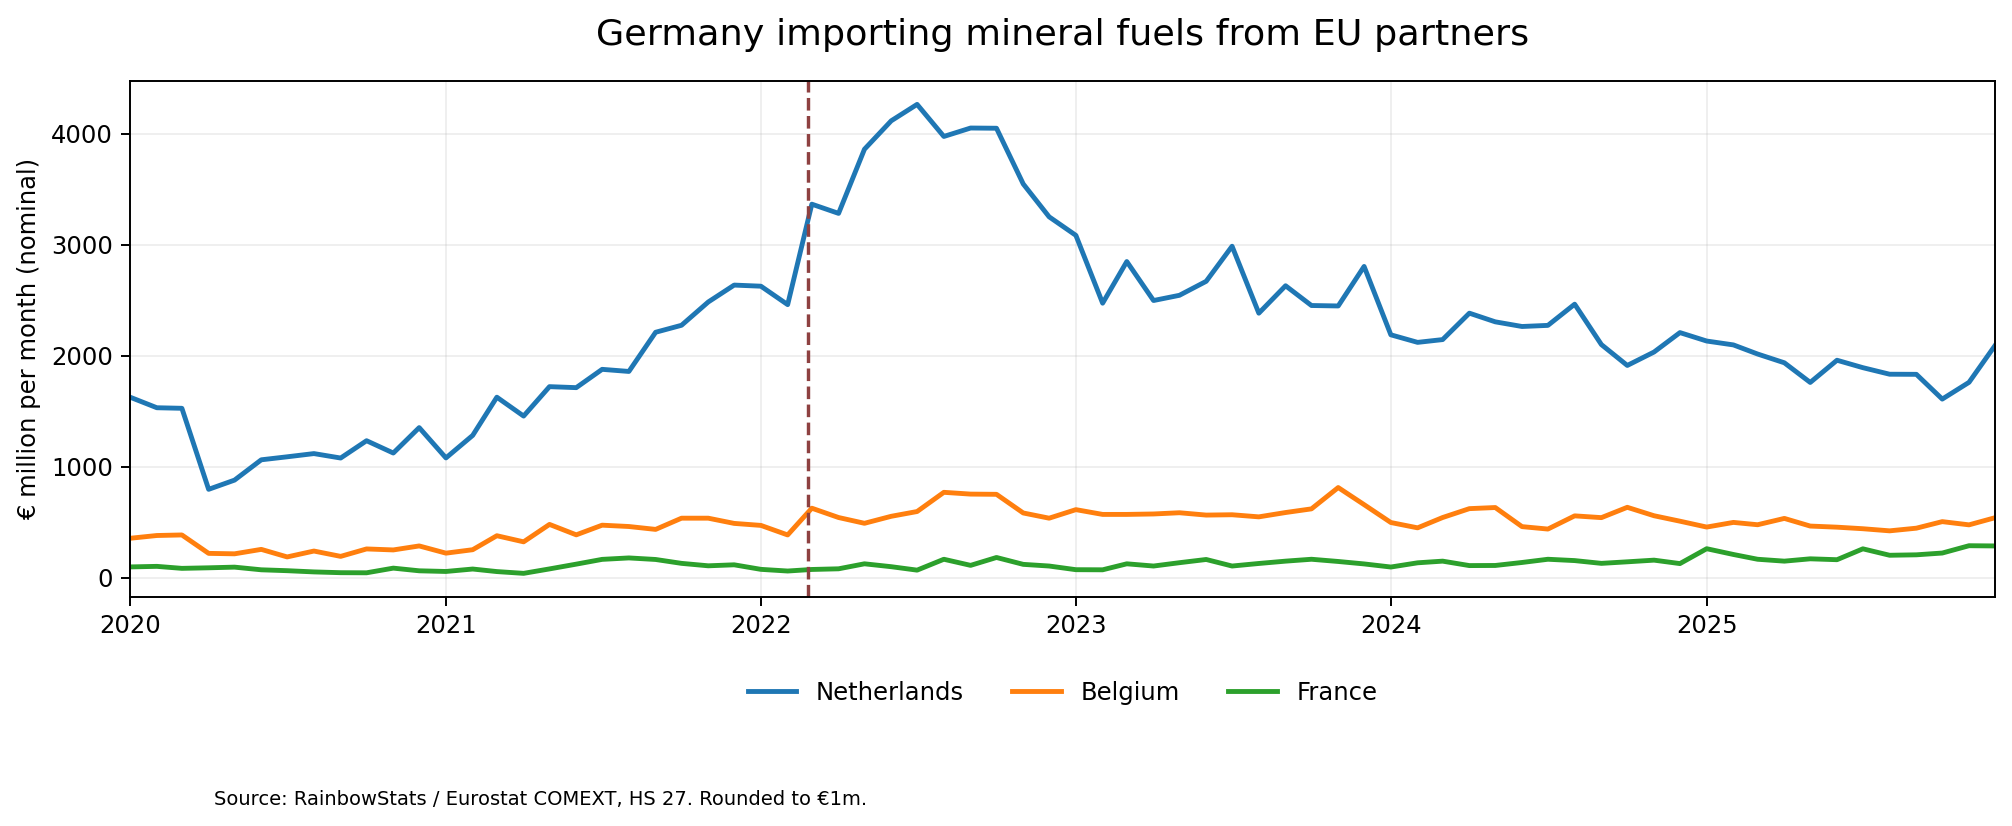
Our appendix adds a second Sankey: Russia → other EU member states → Germany. It makes Europe’s energy interdependence visible. Germany’s mineral-fuel imports from the Netherlands and Belgium remain large even as those countries’ direct imports from Russia have contracted.
That observation raises questions about indirect Russian-origin supplies, but does not answer them. The two links are independent bilateral trade statistics, not a traceable physical shipment. Dutch or Belgian exports to Germany may originate from many countries or domestic processing. We should not mistake a visual connection for proof of circumvention.
The important political-economic conclusion requires no such claim. Germany’s energy decisions depend on its neighbors; its neighbors pursue their own interests. A common market creates interdependence, not uniform national priorities.
Moscow’s incentive to divide
These differences are not simply passive features of European geography. They create vulnerabilities that the Kremlin has incentives to exploit. Vladimir Putin, a former KGB officer, has overseen Russian policies involving energy leverage, disinformation, cyber operations and pressure intended to weaken Western resolve. European officials have repeatedly warned about Russian efforts to erode support for Ukraine and fracture cooperation among NATO allies.
It would be too simple to claim that destroying European unity is Putin’s only objective. Subordinating Ukraine and limiting Western influence are central goals; weakening EU cohesion and the Europe–United States relationship can serve them. Russia need not persuade all 27 countries. Disagreement, delay and uneven political costs can themselves reduce collective effectiveness.
Our trade charts cannot establish Moscow’s intentions or explain the motives of any particular European government. They do, however, reveal the unequal economic relationships within which political pressure operates.
Let Europe arise
Churchill believed European cooperation could prevent national rivalries from again bringing catastrophe to the continent. The European Union has made that vision tangible, and its response to Russia has included real collective sacrifice. But unity is not the same as unanimity, and a union of sovereign states will always negotiate the distribution of costs.
The Sankey shows Europe’s connections; the line chart shows how differently those connections have evolved. Together they reveal both the strength of European integration and its continuing political challenge.
Churchill concluded his Zurich speech: “Let Europe arise!” Europe has arisen. The test now is whether its 27 nations—and their American ally—can sustain a common purpose when Russia seeks to exploit the distance between national interests and collective security. Ukraine’s future depends in part on their answer.
Chart appendix: Cross-country energy flows
The following two figures preserve the network detail behind the essay. They are descriptive bilateral trade flows, not evidence that a given Russian-origin shipment was subsequently sold to Germany.
Interpretation and methods
All figures use Eurostat COMEXT HS 27 import VALUE series. Chapter 27 includes several fuels and related products; it is not synonymous with crude oil or gas. Monetary values are sensitive to commodity prices. Missing observations are not assumed to be zero. The two-stage Sankey shows two independently measured legs, not tracked shipments. Cross-country electricity trade (HS 2716) is a different market and is not mixed into these fossil-fuel charts.
Reproduce this analysis
Run the RainbowStats chart script to inspect the selected country flows and time-series comparisons. The full 27-country Sankey uses an expanded set of bilateral series.
Sources
International Churchill Society — Zurich speech, 19 September 1946
European Commission — REPowerEU and Russian energy phaseout
European Commission — Roadmap towards ending Russian energy imports
Reuters, 15 October 2026 — concerns about Russian efforts to erode Western support for Ukraine
Chart data: Eurostat COMEXT retrieved using RainbowStats, 19 October 2026.