Europe’s Energy Network: Russia’s Retreat and the Uneven Rewiring of Trade
Four commodity networks, two snapshots, and a striking lesson: Europe’s move away from Russian energy was substantial—but it was neither uniform nor complete.
Open the complete RainbowStats replication and interactive slideshow →
A network is more than a collection of bilateral transactions. It is a map of dependence. When one supplier becomes politically or economically unacceptable, its customers must find new suppliers, new routes, or new ways to consume less. Those adjustments do not occur everywhere at the same pace.
Russia’s invasion of Ukraine made that problem unavoidable for Europe. Governments sought to reduce exposure to Russian oil and gas while preserving industrial activity, heating homes, and maintaining political unity. The question is not simply whether trade with Russia fell. It is where the links broke, where new links formed, and where old dependencies persisted.
RainbowStats can now examine this question as a directed, weighted trade network. We use Eurostat COMEXT to compare bilateral import values among twelve European countries and Russia, with separate views for mineral fuels as a whole, crude petroleum, refined petroleum products, and petroleum gases. The main graphics below show the change in Russia’s share of imports from the selected suppliers, measured in percentage points.
1. The broad retreat: all mineral fuels
At the broad HS 27 level, Russia lost share in eleven of the twelve European import markets in our selected-country network. Poland, Italy, and the Netherlands experienced particularly large declines. Hungary was the sole exception: Russia’s measured share increased by 7.7 percentage points.
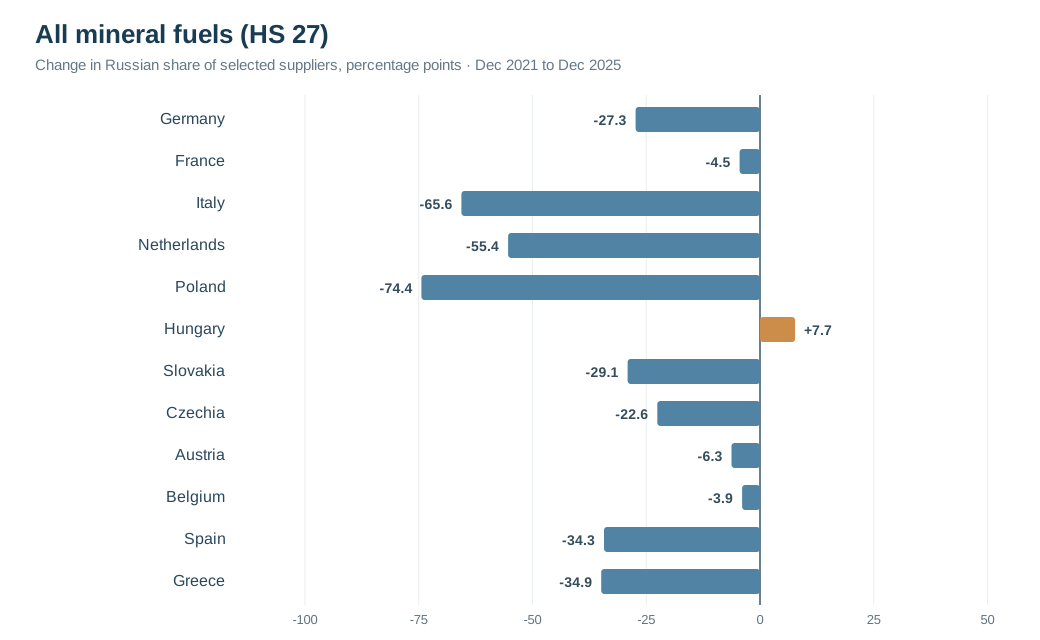
That is a powerful picture, but it can conceal as much as it reveals. HS 27 includes distinct commodities that travel through different infrastructures. Crude oil moves through pipelines and tankers. Refined products pass through refineries, ports, and trading hubs. Gas can arrive by pipeline or as LNG. Aggregating them risks hiding precisely the political and commercial differences we want to understand.
The network also shifted among European suppliers. In the aggregate matrix, Germany gained approximately 58 percentage points of Poland’s selected-supplier share, while Belgium gained approximately 38 points of the Netherlands’ share. These are changes in the composition of reported immediate trade partners; they do not prove where the underlying energy was originally produced.
2. Crude oil: a dramatic reorganization
Crude petroleum (HS 2709) presents the starkest evidence of Russia’s loss of market position. The reported Russian supplier share fell by almost 100 percentage points in Poland and Greece, more than 90 points in France and the Netherlands, and roughly 89 points in Italy.
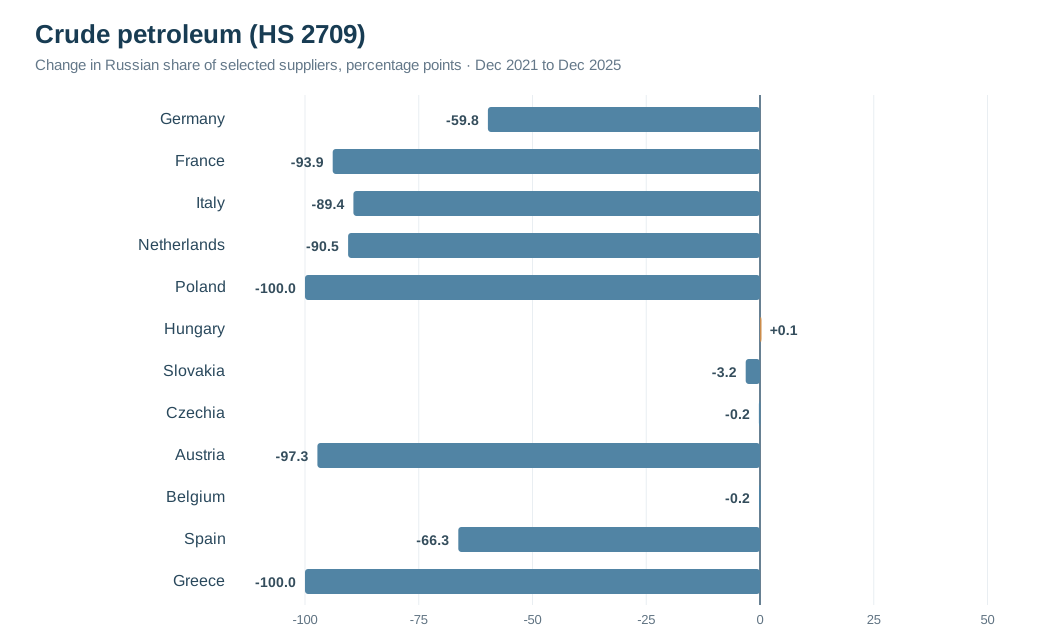
Poland is particularly instructive. The monthly Poland–Russia crude series shows substantial reported trade in 2021 and 2022, then ends with an observation in March 2023. Our December 2025 snapshot therefore contains no observation for that bilateral edge. The network treats an absent edge as zero weight, which is appropriate for displaying reported links but not equivalent to independently proving zero physical deliveries.
The crude matrix also shows an almost complete shift toward Czechia as a reported supplier to Poland. Such an extreme substitution could arise from a narrow selected-country denominator or data-reporting characteristics. We should verify it against the underlying monthly bilateral series and, ideally, total imports from all suppliers before presenting it as a change in the physical origin of Poland’s crude.
Hungary and Slovakia tell a different story. Their Russian crude supplier shares changed little in these snapshots compared with much of Western Europe. That contrast is consistent with the broader importance of pipeline access and contractual arrangements, although the trade matrix alone cannot establish the reasons.
3. Refined products: the importance of intermediaries
Refined petroleum products (HS 2710) form a more intricate network. Russia’s selected-supplier share fell across nearly every market, with especially large declines in Greece, Poland, Spain, France, and Italy.
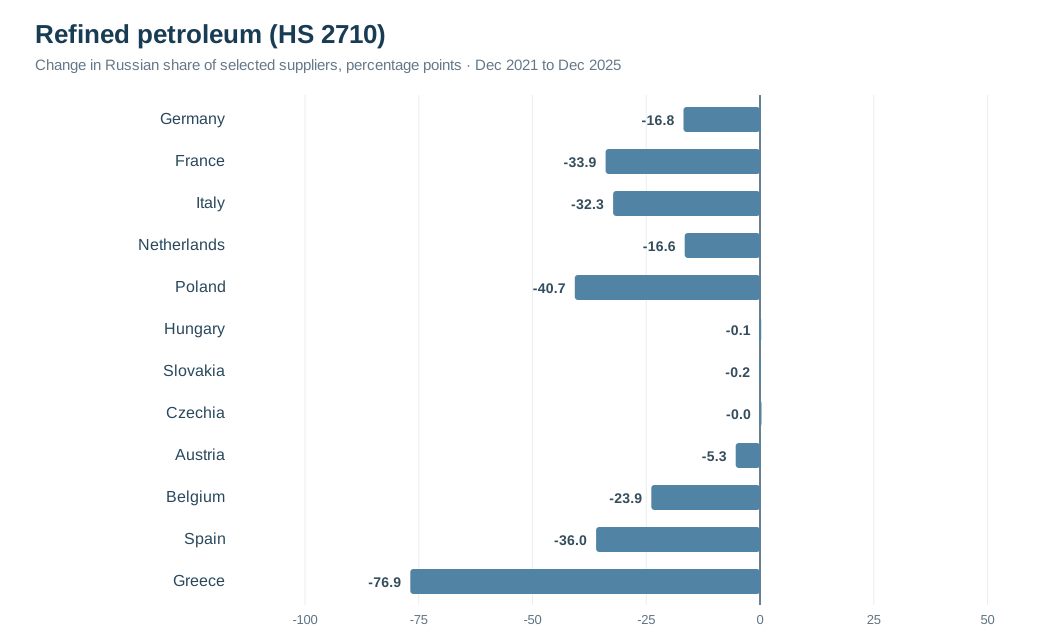
At the same time, the Netherlands gained approximately 48 percentage points of Italy’s selected refined-product imports, and Germany gained about 37 points in Poland. These shifts illustrate why a Sankey diagram is useful alongside a bar chart: the bar chart shows the retreat of one supplier; the network shows which immediate trading relationships expanded.
There is an essential qualification. A refined product imported from a European trading hub need not have been made from crude originally produced there. Customs data identify the reported partner, not a complete chain of physical provenance. A change in the immediate partner is evidence of a reconfigured commercial network, not necessarily the elimination of all upstream exposure to Russian energy.
4. Petroleum gases: the exception that changes the story
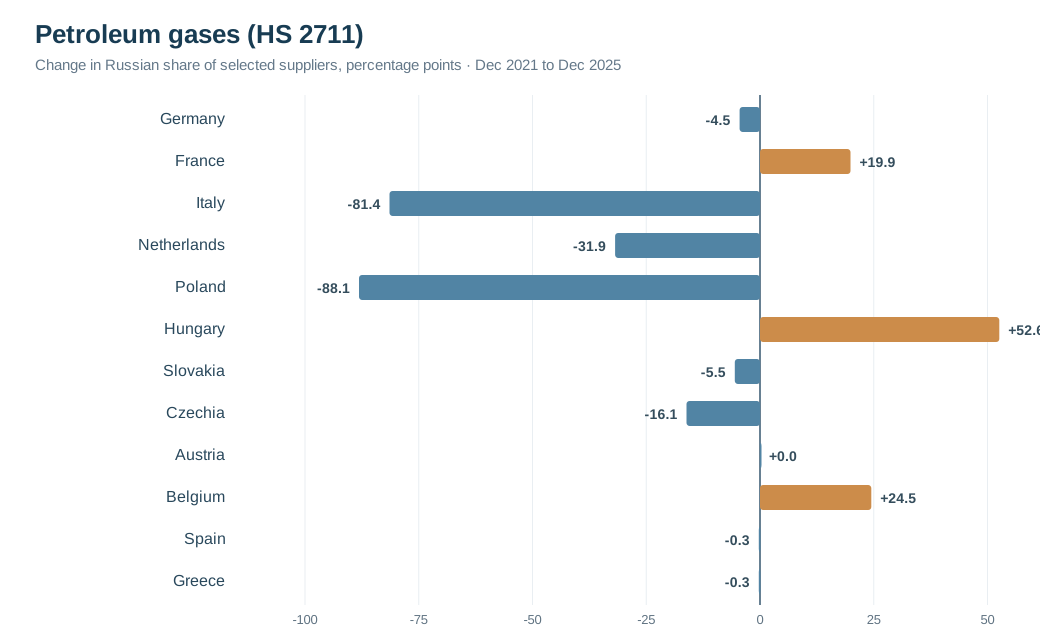
The petroleum-gas network (HS 2711) is the most politically revealing—and the least uniform. Russia’s selected-supplier share fell sharply in Poland and Italy, yet increased by approximately 53 percentage points in Hungary, 24 points in Belgium, and 20 points in France.
Hungary: relative share and absolute value rose
The monthly bilateral series supports the Hungarian exception. Reported imports of Russian HS 2711 products were approximately €72 million in December 2021 and €199 million in December 2025. The measured increase in Russian share therefore accompanies an increase in absolute reported trade value, although the euro amounts also reflect price changes.
France: a rising share can coexist with falling trade
France provides the opposite lesson. Russia’s share of France’s selected petroleum-gas suppliers increased by approximately 20 percentage points, yet the reported France–Russia bilateral trade value fell from about €613 million in December 2021 to €227 million in December 2025. The relative share rose even though the absolute value declined. That is precisely why dependence ratios and raw trade values must be read together.
Belgium: a volatile series
Belgium’s Russian petroleum-gas trade value rose from approximately €26 million in December 2021 to €134 million in December 2025. The historical monthly series, however, is volatile. Two December observations are useful endpoints, not a complete description of the intervening years. The appendix points readers to the reproducible monthly charts.
5. A network can change without becoming independent
These results suggest three different phenomena. First, there was a broad contraction of Russia’s role in many European energy import relationships. Second, trade was redirected toward alternative immediate suppliers, including European hubs. Third, a number of dependencies persisted or even increased in relative terms, most conspicuously in Hungary’s gas market.
One can see a larger political lesson in this unevenness. Europe’s ability to act collectively depends partly on the distribution of the costs of collective action. A country that can switch suppliers relatively easily faces a different economic choice from one tied to existing infrastructure. That divergence creates an opening for political pressure and attempts to exploit differences among European governments. The trade data illuminate the asymmetry; they do not, by themselves, establish any government’s motives or the effectiveness of Russian political strategy.
The graph-theoretic approach makes these differences visible. Directed edges identify exporter-to-importer relationships. Edge weights measure reported bilateral trade values. Column-normalized matrices describe the relative supplier composition for each importer. Sankey diagrams show the changing geometry of the network. And historical line charts test whether the snapshot comparisons represent persistent changes or exceptional months.
6. Conclusion: diversification is not the same as immunity
Between December 2021 and December 2025, the European energy trade network underwent substantial reorganization. Russia’s reported share declined sharply across much of the network, particularly for crude petroleum. Yet the experience was far from uniform. Hungary’s petroleum-gas relationship intensified in both relative and absolute euro-value terms; France’s relative Russian share increased even as its bilateral value declined; and the refined-products network developed stronger links through European trading hubs.
For policymakers, the lesson is to measure both the strength and the structure of economic dependence. For analysts, it is to resist the temptation to read a large percentage-point change as a complete account of physical trade. Network charts, dependence matrices, and monthly time series are most persuasive when used together.
The analysis is reproducible in RainbowStats. Readers can inspect the country-pair data, compare the four commodity networks, and extend the analysis beyond the endpoints considered here.
Reproduce the four-network analysis in RainbowStats →
Appendix A. Country-level changes in Russian supplier share
Percentage-point changes between the final reported monthly observations of the two selected calendar years. Rows are importing countries; each cell reports Russia’s change in share among the twelve selected exporters. Rounded to one decimal place.
| Importer | HS 27 | HS 2709 | HS 2710 | HS 2711 |
|---|---|---|---|---|
| Germany | -27.3 | -59.8 | -16.8 | -4.5 |
| France | -4.5 | -93.9 | -33.9 | +19.9 |
| Italy | -65.6 | -89.4 | -32.3 | -81.4 |
| Netherlands | -55.4 | -90.5 | -16.6 | -31.9 |
| Poland | -74.4 | -100.0 | -40.7 | -88.1 |
| Hungary | +7.7 | +0.1 | -0.1 | +52.6 |
| Slovakia | -29.1 | -3.2 | -0.2 | -5.5 |
| Czechia | -22.6 | -0.2 | -0.0 | -16.1 |
| Austria | -6.3 | -97.3 | -5.3 | +0.0 |
| Belgium | -3.9 | -0.2 | -23.9 | +24.5 |
| Spain | -34.3 | -66.3 | -36.0 | -0.3 |
| Greece | -34.9 | -100.0 | -76.9 | -0.3 |
A zero or near-zero change may reflect a small or absent reported edge; it should not be interpreted as proof of unchanged physical dependence.
Appendix B. Historical line-chart checks
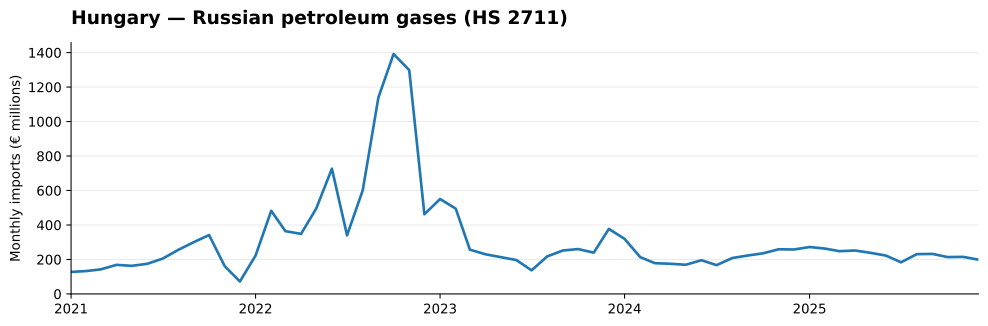
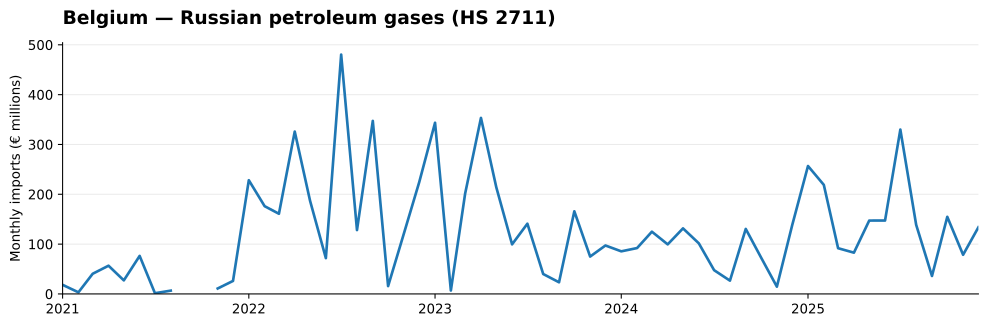
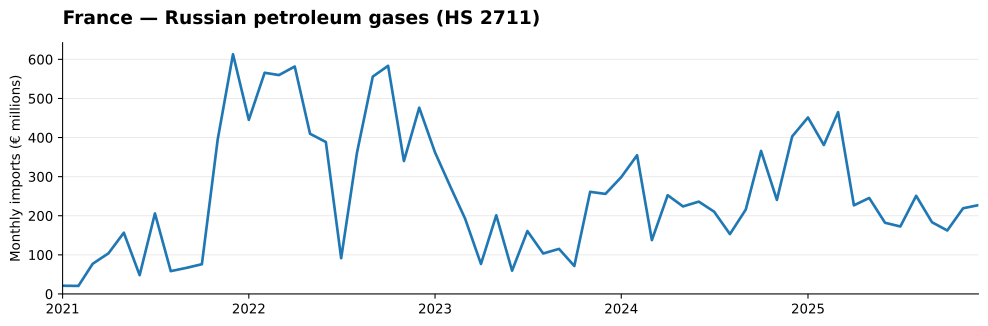
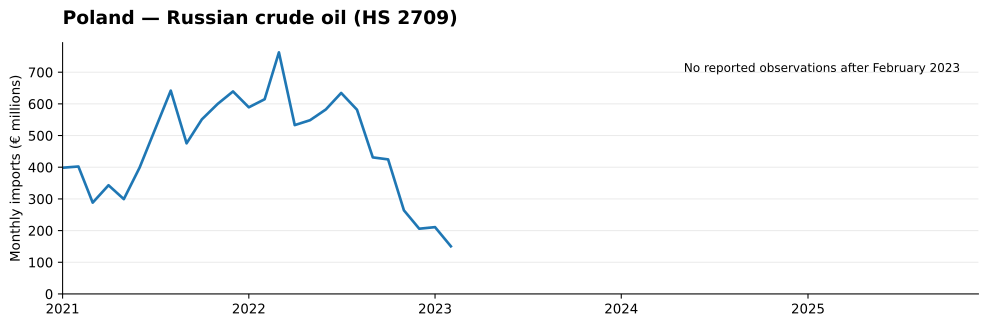
We ran January 2021–December 2025 monthly COMEXT series for Hungary–Russia petroleum gases, Belgium–Russia petroleum gases, France–Russia petroleum gases, and Poland–Russia crude petroleum. The key verified observations are summarized below. The four SVG line charts below reproduce the reported monthly COMEXT observations returned by RainbowStats. Missing months are left blank, not interpolated. Download the corresponding CSV directly using the link below each chart (also included in the ZIP).
| Series | Dec 2021 | Dec 2025 | Comment |
|---|---|---|---|
| HU ← RU, HS 2711 | €72.2m | €198.7m | Higher value and share |
| BE ← RU, HS 2711 | €26.1m | €133.8m | Volatile monthly values |
| FR ← RU, HS 2711 | €613.0m | €227.1m | Lower value, higher selected-supplier share |
| PL ← RU, HS 2709 | €639.3m | Not reported | Last observed February 2023 |
RainbowStats commands for the appendix charts:
HU=COMEXT(HU.RU.2711.IMPORT.VALUE.202101.202512)
BE=COMEXT(BE.RU.2711.IMPORT.VALUE.202101.202512)
FR=COMEXT(FR.RU.2711.IMPORT.VALUE.202101.202512)
PL=COMEXT(PL.RU.2709.IMPORT.VALUE.202101.202512)
SLIDESHOW(LINE_CHART(HU),LINE_CHART(BE),LINE_CHART(FR),LINE_CHART(PL))
Appendix C. Methods, definitions, and limitations
Source. Eurostat COMEXT, DS-045409, monthly bilateral trade values in euros. The RainbowStats COMEXT requests use product codes 27, 2709, 2710, and 2711, with IMPORT and VALUE. The twelve importing countries are Germany, France, Italy, Netherlands, Poland, Hungary, Slovakia, Czechia, Austria, Belgium, Spain, and Greece. Russia is included as a supplier, not as a measured importing reporter.
Dates. The network comparison uses 202101–202112 and 202501–202512. Each network edge is weighted by the last finite monthly observation in the requested interval, normally December. It is not an annual trade total. The historical appendix uses the longer January 2021–December 2025 range.
Direction. A directed edge runs from the reported exporter/partner to the importing/reporter country. An importer’s dependence share is the bilateral import value from one of the selected exporters divided by the sum of its reported imports from all selected exporters. The bar charts multiply the difference in these shares by 100 to express percentage points.
Scope. HS 27 includes its subcategories, so it must not be added to HS 2709, HS 2710, and HS 2711 as if they were disjoint groups. HS 2711 includes petroleum gases beyond natural gas. The values are in euros and are sensitive to prices, exchange-rate effects, and commodity mix. Trade partner does not necessarily identify original energy provenance or physical transport route.
Missing data. The current network implementation assigns zero weight to absent bilateral observations. That convention is useful for graph display but does not distinguish a genuine reported zero from missing data. A missing observation should not be described as a verified zero import. This limitation is particularly relevant for extreme crude-oil share changes and the unmeasured Russia importer column.
Replication. Full four-product RainbowStats slideshow and data matrices.