Europe's Changing Energy Trade Network
What five European countries reveal about the shifting structure of mineral-fuel trade before and after Russia's full-scale invasion of Ukraine.
Explore and reproduce the complete RainbowStats analysis →
Energy security becomes economic security
Russia's invasion of Ukraine in February 2022 confronted Europe with a fundamental question: how much economic independence can a continent claim when essential energy supplies are vulnerable to geopolitical coercion? European governments sought alternative supplies, invested in infrastructure, and reconsidered the relationships through which energy reaches consumers.
Four years later, it is possible to examine one aspect of that adjustment with trade data. Rather than begin with national totals, we ask how the connections between countries changed. Did established suppliers retain their positions? Did new routes become more important? And does a change in recorded trading partner necessarily mean a change in the ultimate source of energy?
Turning trade flows into a network
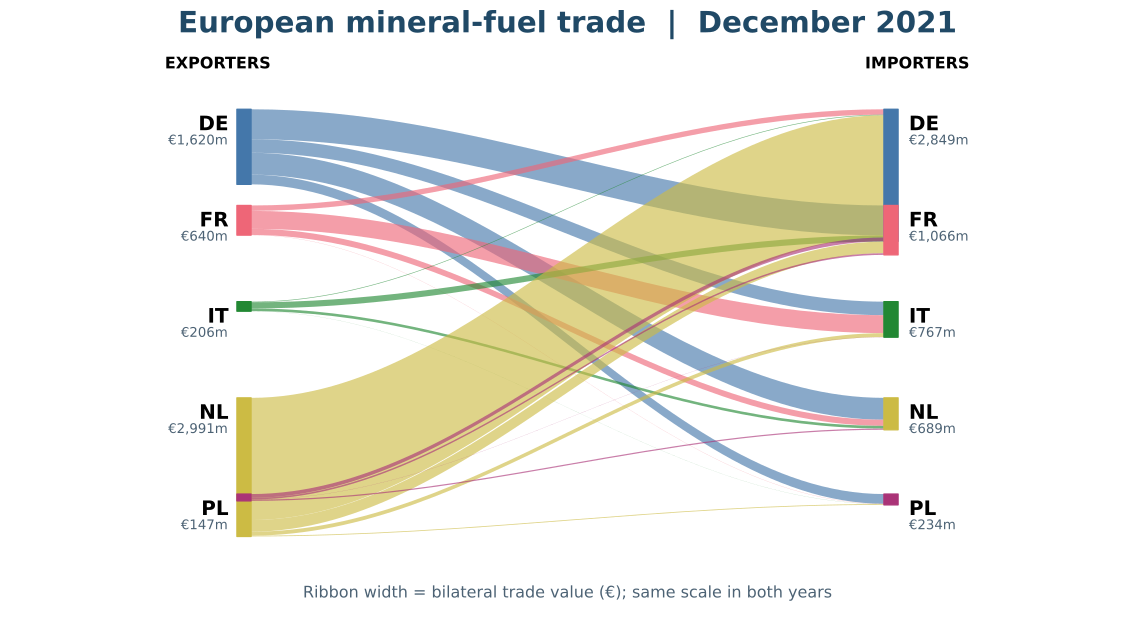
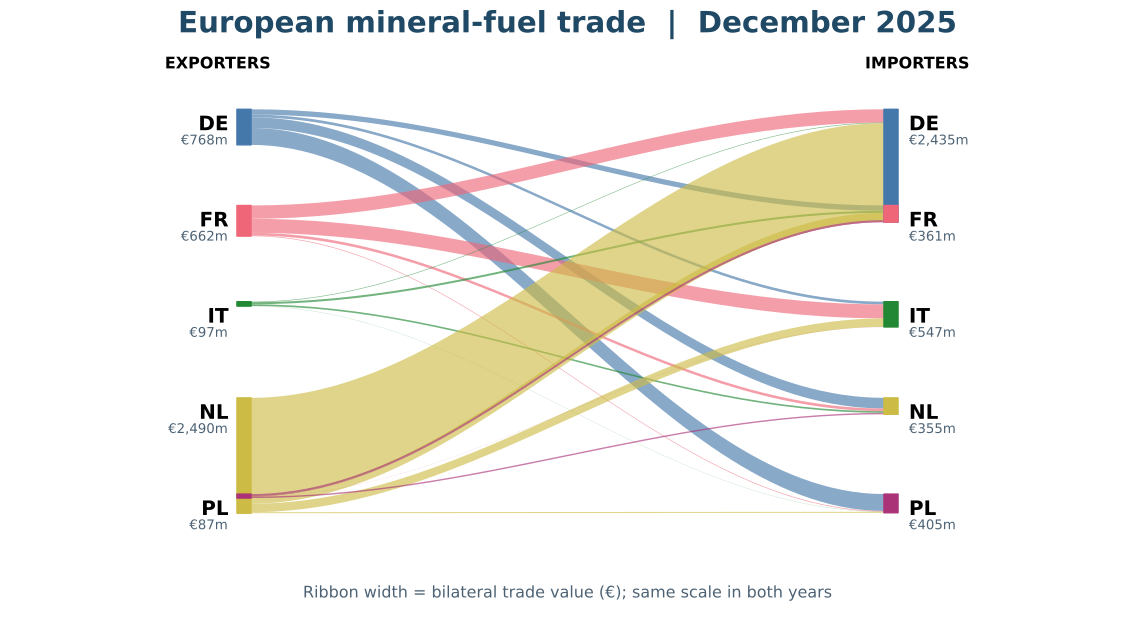
Using RainbowStats, we retrieved importer-reported bilateral trade values from Eurostat COMEXT for Germany (DE), France (FR), Italy (IT), the Netherlands (NL), and Poland (PL). The commodity group is HS chapter 27: mineral fuels, mineral oils, and related products. Each country becomes a node; each flow from exporter to importer becomes a directed, weighted link.
The network is represented by an adjacency matrix, T, where Tij is the reported value shipped from exporter i to importer j. We compare December 2021, before the invasion, with December 2025. These are monthly snapshots, not annual totals.
Measuring dependence, not just volume
A country's largest bilateral trade flow is not necessarily its greatest vulnerability. To study relative importance, we divide the value imported from each selected exporter by the importer's total purchases from all five selected countries. Formally, Dij = Tij / ΣkTkj. Each nonempty importer column sums to one.
We then calculate 100 × (D2025 − D2021). The resulting figures are percentage-point changes in import shares within the selected five-country network.
| Exporter / importer | DE | FR | IT | NL | PL |
|---|---|---|---|---|---|
| DE | — | -28.96 | -27.31 | -3.91 | +0.44 |
| FR | +7.70 | — | +4.83 | -2.84 | +1.85 |
| IT | +0.04 | -0.25 | — | +1.86 | +0.03 |
| NL | -6.65 | +29.79 | +22.54 | — | -2.32 |
| PL | -1.08 | -0.58 | -0.06 | +4.89 | — |
Table 1. Percentage-point changes in mineral-fuel import shares, December 2021 to December 2025. Rows are exporters; columns are importers. Source: RainbowStats calculations using Eurostat COMEXT. Rounding may affect totals.
France and Italy: the Netherlands gains share
Two shifts are especially conspicuous. Among France's purchases from the five countries, the Netherlands gained approximately 29.8 percentage points of import share while Germany lost 29.0 points. Among Italy's purchases, the Netherlands gained approximately 22.5 points while Germany lost 27.3 points.
But the raw trade values complicate the story in a useful way. Dutch shipments to France actually declined from approximately €251 million in December 2021 to €193 million in December 2025. German shipments to France fell much more sharply, from about €647 million to €115 million. Thus the Netherlands gained share even as its recorded flow declined. A rising dependence ratio is not the same as rising physical or monetary imports from that supplier.
Italy provides a different combination: Dutch shipments rose from roughly €84 million to €183 million, while German shipments declined from approximately €292 million to €59 million. Here the change in shares accompanies both a Dutch increase and a German decrease in reported value.
The Rotterdam question
The Netherlands occupies an unusual position in European energy logistics. Rotterdam links ocean shipping, refining, storage, pipelines, and inland distribution. Some goods exported from the Netherlands were produced elsewhere or refined from imported feedstocks. Recorded Dutch exports therefore should not automatically be read as Dutch-origin energy.
That distinction matters when evaluating Europe's response to Russia. Replacing one direct bilateral supplier with a European trading hub may represent genuine diversification, rerouting, changes in processing location, or some combination. These five-country matrices alone cannot determine which explanation dominates.
What the diagrams add
The two alluvial diagrams make the network tangible. The unusually substantial Netherlands-to-Germany ribbon remains visible in both periods, although its reported value falls from about €2.64 billion to €2.09 billion. That is an important reminder that a trade hub may remain central even while the composition and value of its connections change.
RainbowStats also preserves the original monthly bilateral series behind each network. Those time-series charts can help distinguish abrupt breaks from gradual adjustments and identify episodes dominated by the 2022 energy-price shock. Readers can inspect them in the linked interactive analysis.
What these results cannot establish
Several cautions are essential. HS 27 combines natural gas, crude oil, refined petroleum, coal, and related goods with different markets and transport systems. These comparisons use December values, not full-year averages or physical quantities. Prices can change trade values independently of volumes. The network excludes suppliers outside the selected five countries, including important extra-EU sources. Finally, the immediate exporter may not be the original producer.
Consequently, these results establish changes in reported bilateral trade structure, not a definitive measure of Europe's worldwide energy security or its ultimate exposure to Russian-origin fuels.
Networks reveal relationships
Europe's energy adjustment is not simply a contest between old and new suppliers. It is a reorganization of commercial routes, infrastructure, and dependence. Our five-country study shows a marked redistribution of reported mineral-fuel import shares between December 2021 and December 2025, especially toward the Netherlands in France and Italy's selected supplier networks.
Economic dependence is not merely a quantity. It is a relationship within a network.
By combining Eurostat trade data, matrix algebra, alluvial charts, and retained bilateral time series, RainbowStats makes those relationships visible and reproducible. The next step is to broaden the network, distinguish individual energy products, and trace flows beyond their immediate European trading partners.
The question for Europe remains: has it reduced its vulnerabilities, or merely changed the routes through which those vulnerabilities travel?
Reproduce the analysis: RainbowStats interactive network study.
Data: Eurostat COMEXT, HS chapter 27, importer-reported trade values.
Methods: weighted directed networks, column-normalized dependence matrices, percentage-point comparison, and alluvial visualization.