I ride Seattle's bike trails daily. Those rides give me time to reflect. This morning Mount Rainier was particularly clear, and the view gave me an insight about the machine-learning exercise I had been working on: Can we not turn 1,000 trees into an equation that we can understand?
The question sounds almost contradictory. We use Random Forest because we do not want to impose a simple functional form. Hundreds or thousands of trees are free to search for nonlinearities, interactions and thresholds. The resulting model can predict well—but then we are left staring at the forest.
This article continues the argument in my previous post, Don't Forget BLUE. There I argued that machine learning and econometrics answer different questions: OLS gives us familiar coefficient-based inference, while Random Forest gives us flexible nonlinear prediction. Here I ask the next question: what did the forest actually learn?
The experiment
We use the same BIS-inspired teaching exercise: a Treasury Market Conditions Indicator as the dependent variable, with federal debt held by the public as a percent of GDP and NBFI Treasury holdings as explanatory variables. This is not a causal model or a replication of the full BIS specification. Its purpose is to make the machinery visible.
A forest really is an equation
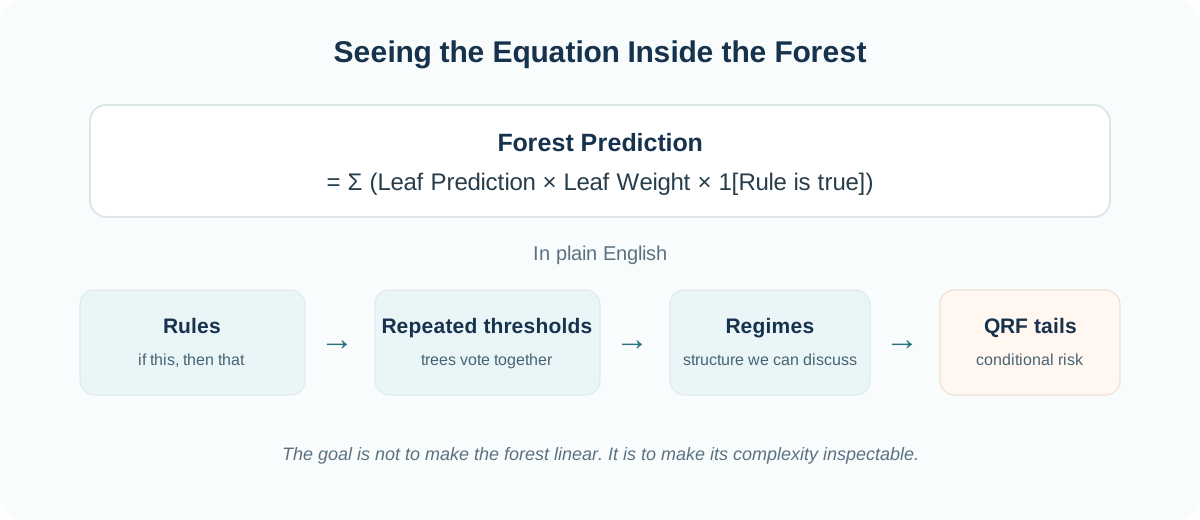
A regression tree is a piecewise-constant function. If tree b contains terminal regions R and predictions c, it can be written as:
A Random Forest containing B trees is their average:
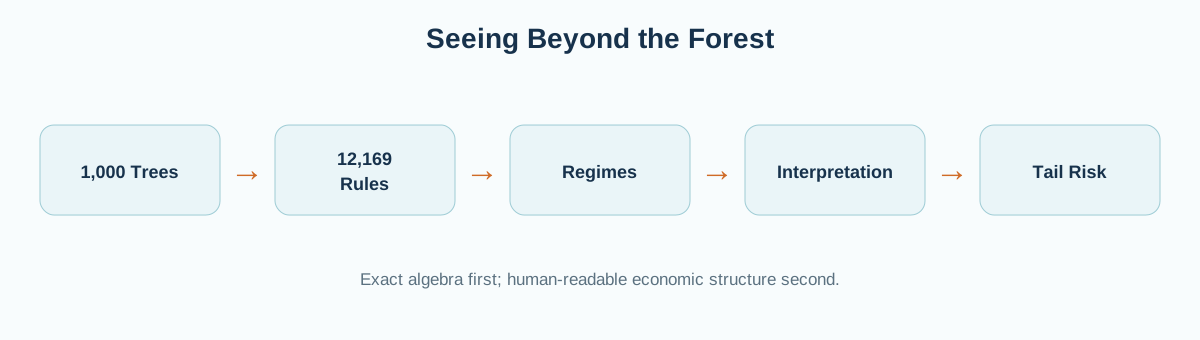
For our fitted model, B = 1,000 and the forest contains 12,169 terminal rules. That is exact algebra, but replacing 1,000 pictures of trees with 12,169 indicator terms has not yet solved the human problem.
EXTRACT(RF,equation)
EXTRACT(RF,rules)
EXTRACT(RF,regimes)
From rules to regimes
Bootstrap sampling means different trees often discover nearby thresholds. One tree may split Debt/GDP near 95%, another near 96%, another near 97%. Those need not represent three distinct economic stories. They can be interpreted as repeated votes for a similar region of predictor space.
RainbowStats therefore clusters nearby thresholds chosen by the fitted trees. It reports the threshold neighborhood, split votes, trees voting, tree-vote percentage, node observations and the average right-minus-left change in the forest prediction.
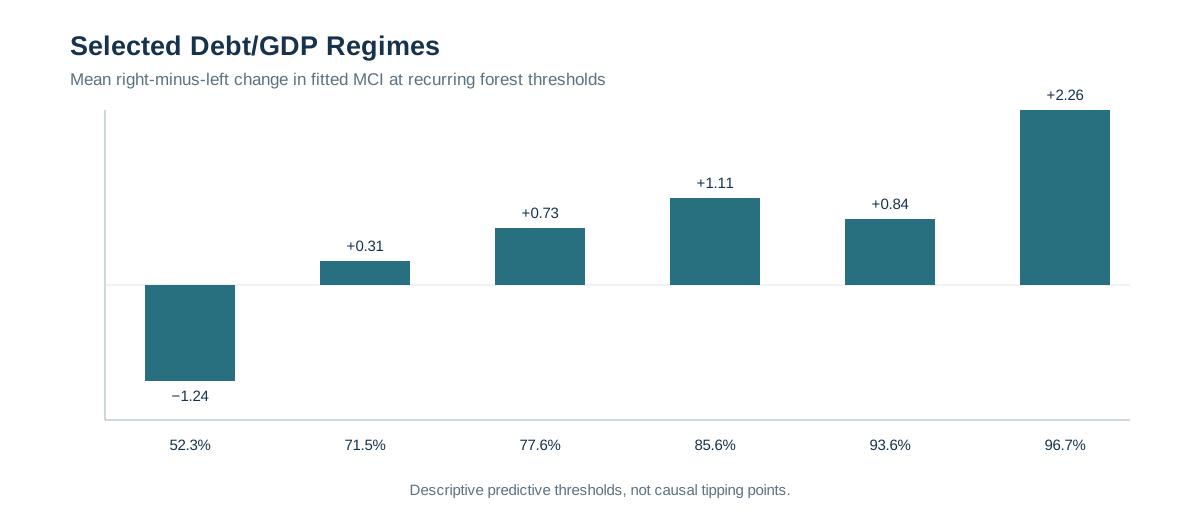
| Approx. Debt/GDP threshold | Trees voting | Tree vote | Mean right−left MCI |
|---|---|---|---|
| 52.3% | 611 | 61.1% | −1.24 |
| 71.5% | 634 | 63.4% | +0.31 |
| 77.6% | 319 | 31.9% | +0.73 |
| 85.6% | 148 | 14.8% | +1.11 |
| 93.6% | 270 | 27.0% | +0.84 |
| 96.7% | 226 | 22.6% | +2.26 |
What the regimes tell us
The most important result is not simply that “debt matters.” The forest finds a non-monotonic relationship. Around 52% Debt/GDP the average local right-minus-left prediction is negative, while several higher-debt regions are positive. Near the 95.7–97.5% neighborhood, 226 trees select a split and the average local prediction difference is roughly +2.26 MCI units.
NBFI holdings also generate repeated threshold regions with both positive and negative local differences. Again, this is predictive structure rather than a causal claim. But it tells us something a single slope coefficient cannot: the fitted relationship changes across the predictor space.
OLS and the forest answer different questions
OLS compresses the relationship into coefficients, standard errors and familiar inferential diagnostics. Random Forest gives up that compact representation to discover nonlinear predictive structure. The new extraction tools let us interrogate what we gave up.
SLIDE(EXTRACT(RF,regression))
EXTRACT(RF,equation)
EXTRACT(RF,rules)
EXTRACT(RF,regimes)
The regression asks, “What does the average linear relationship look like?” The forest tools ask, “What nonlinear boundaries did the machine repeatedly use?” This is a complement to Don't Forget BLUE, not a rejection of it.
Then Quantile Random Forest changes the question
A conventional regression forest averages terminal predictions. Quantile Random Forest retains the observations occupying those terminal leaves and uses their forest weights to estimate a conditional distribution. We can therefore use the same interpretability sequence and then examine the tails.
EXTRACT(QRF,equation)
EXTRACT(QRF,rules)
EXTRACT(QRF,regimes)
EXTRACT(QRF,quantiles)
From a black box to a conversation
Calling a Random Forest a “black box” can become an excuse not to interrogate it. A tree itself is simple: variable → threshold → left or right → prediction. Complexity comes from repetition.
Our workflow is therefore straightforward: fit the forest; write its exact algebraic representation; expose its terminal rules; consolidate repeated thresholds into regimes; count how much of the forest votes for each regime; examine how predictions differ across those boundaries; and finally use QRF to examine the conditional tails.
We have not made the model simple. We have made its complexity inspectable.
How to see beyond the forest
My bike ride began with Mount Rainier and a simple question: can we turn 1,000 trees into an equation we can understand?
The answer is both yes and no. Yes, because the forest has an exact algebraic representation. No, because an equation containing 12,169 indicator terms is scarcely more understandable than 1,000 trees.
The useful insight comes one step later. Those thousands of rules are not necessarily thousands of independent ideas. Trees repeatedly discover similar boundaries. Once those repeated decisions are collected, a much smaller set of recurring regimes begins to emerge.
Then the conversation changes from “the Random Forest says so” to something we can examine: hundreds of independently bootstrapped trees repeatedly partitioned the data in this neighborhood, and the fitted prediction changed materially across that boundary.
That is where econometrics and machine learning complement one another particularly well. OLS gives us a compact inferential model. Random Forest gives us flexible nonlinear predictive structure. Rule and regime extraction helps us understand what created that structure. Quantile Random Forest shows how that structure reaches into the tails.
The objective is not to choose between econometrics and machine learning. It is to keep asking the machine enough questions that we understand what it has actually learned.
And sometimes, apparently, it takes a bike ride and a mountain to think of the question.